Procedure
Step 1 Select Setting > Event > People Counting > Diagram.
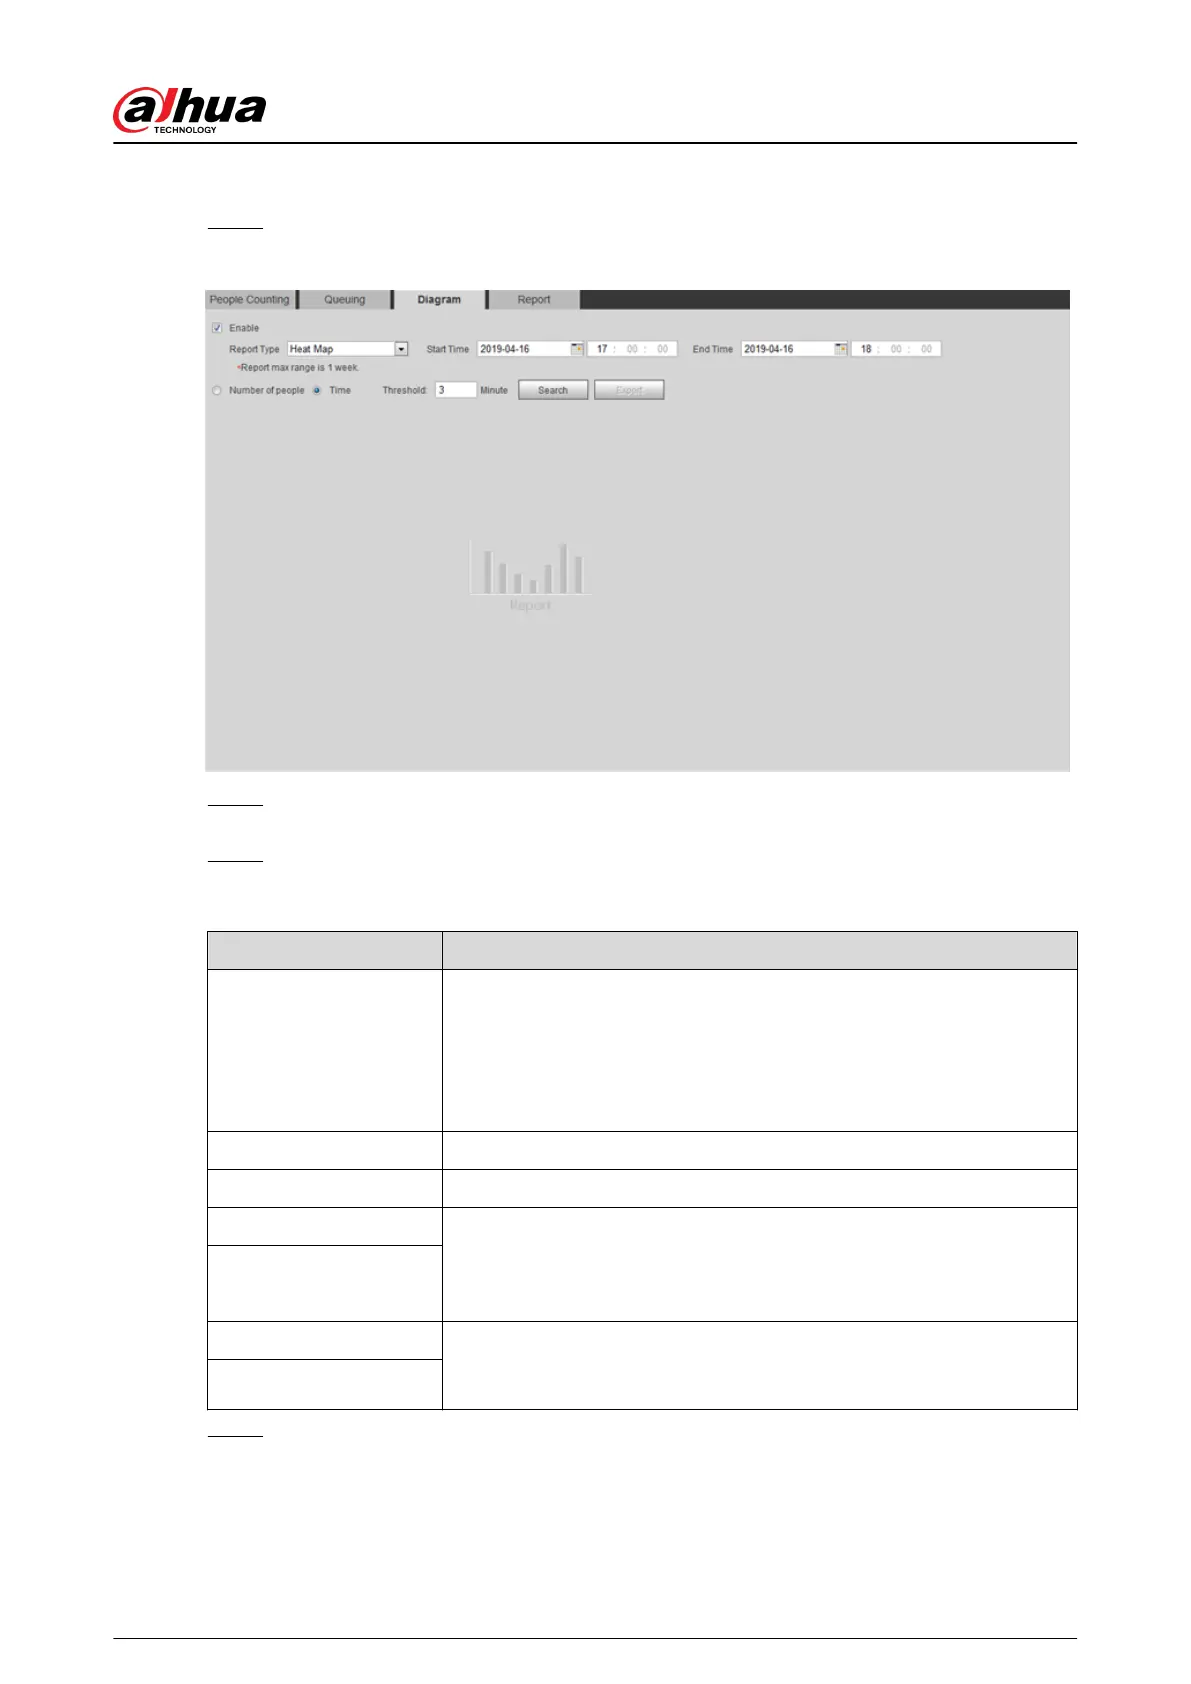
Figure 5-70 Diagram
Step 2 Select the Enable check box to enable diagram function. And then you can search the
diagram during the set period.
Step 3 Set the searching criteria.
Table 5-18 Description of searching criteria
Parameter
Description
Report Type
Select the report type from the following two types:
●
Heat Map : Density statistics of moving object, the color range is
from blue to red, blue means the minimum heat value and red
means the maximum heat value.
●
Track Map : Tendency statistics of moving object.
Start Time The start time of the report.
End Time The end time of the report.
Number of People When selecting heat map as the report type, you can select Number of
People, and set the threshold. The system searches the diagram
according to the number of people in the area, and shows the heat
map.
Threshold
Time When selecting heat map as the report type, you can select Time, and
set the threshold. The system searches the diagram according to the
queuing time in the area and shows the heat map.
Threshold
Step 4 Click Search to complete the diagram.
Click Export to export the report.
Operation Manual
196
 Loading...