Dahua Network Camera Web 3.0 Operation Manual
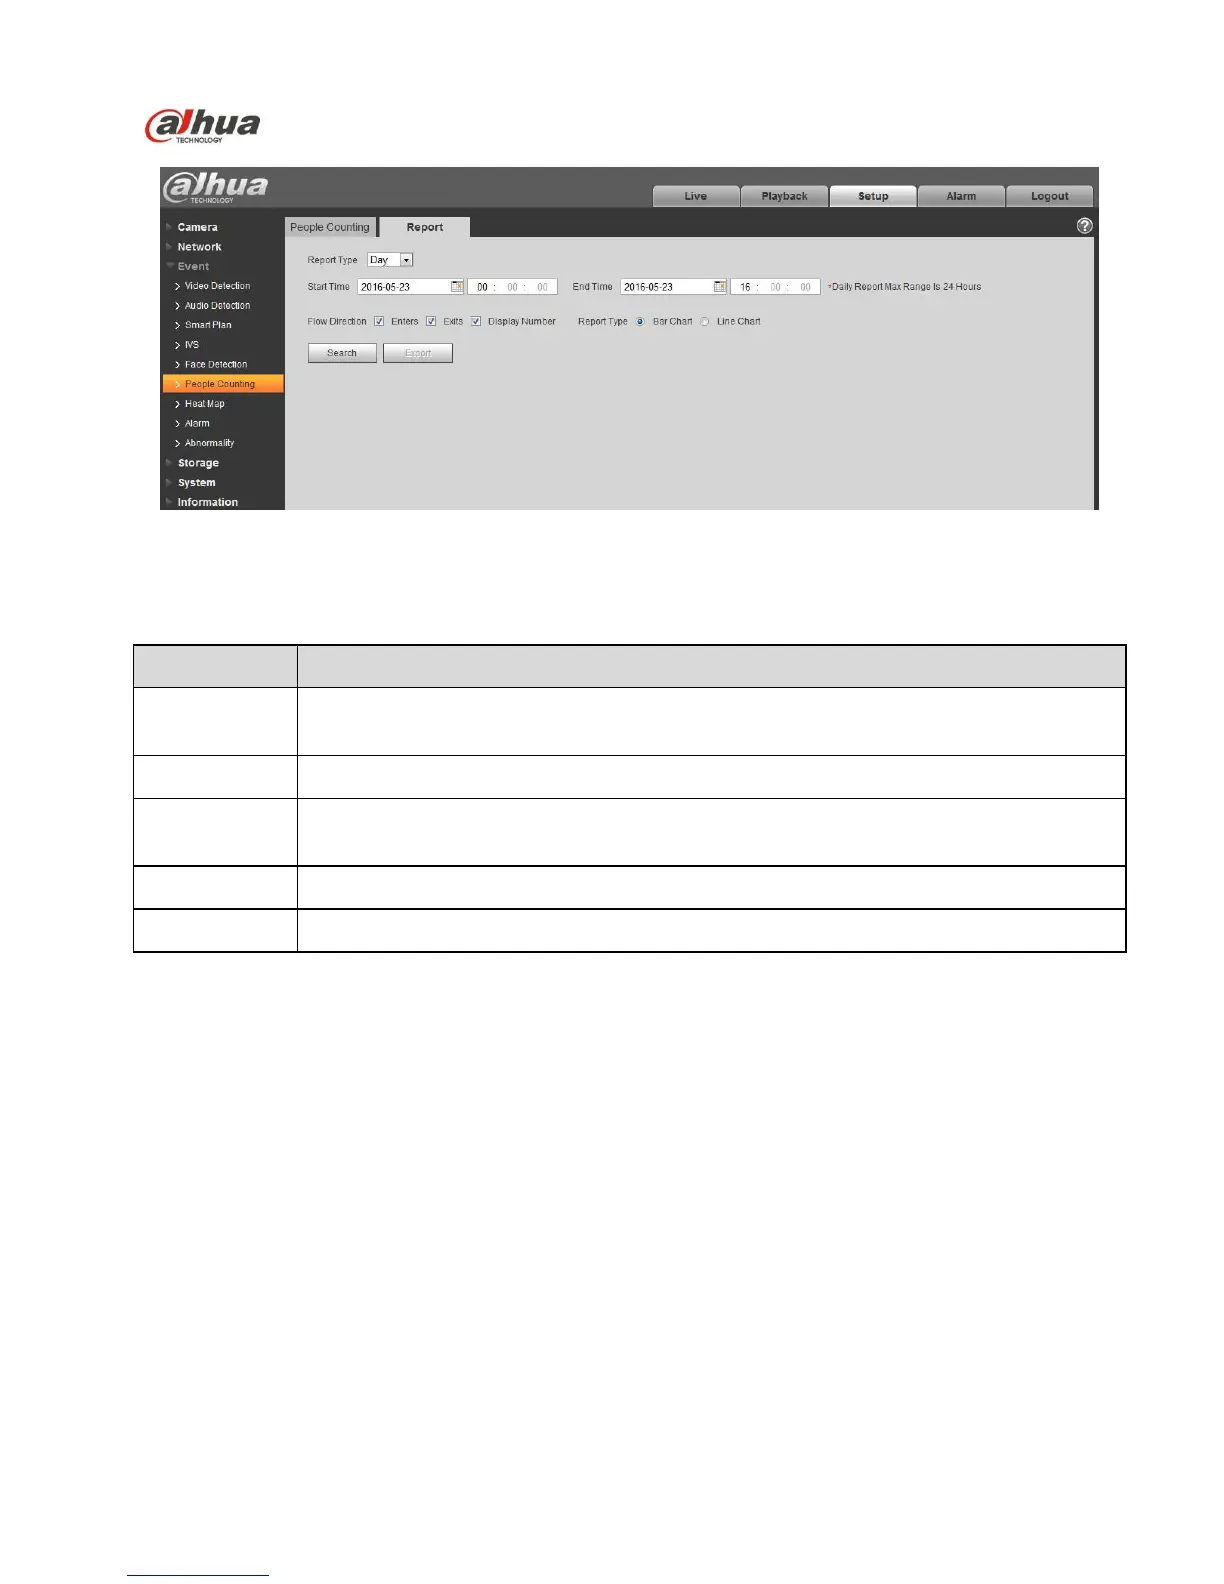
Figure 5-81
Step 2
It is to set search condition, please refer to the following sheet for more details.
Can select day report, month report and year report; also can select bar chart or line
chart to display the report.
It can set the begin /end time within the range of statistics time.
It can select enter, leave and display number; the data of checked item can be
displayed in the report.
Search flow statistics data according to the setting to form report.
Step 3
Click “Search” to complete report statistics, click “Export” to export the report.
5.3.7 Heat Map
5.3.7.1 Heat Map
It is the density statistics of moving object that can generate report, the color range is from blue to red,
blue means the min heat value and red means the max heat value.
Mirroring, view angle change and heat map original data will be cleared.
Step 1
Select “Setup > Event > Heat Map > Heat Map” and the system will display the interface of “Heat Map”,
which is shown in Figure 5-82.