EASYSENSE Q3+ and Q5+ DO185 (2)
The EASYSENSE software overview
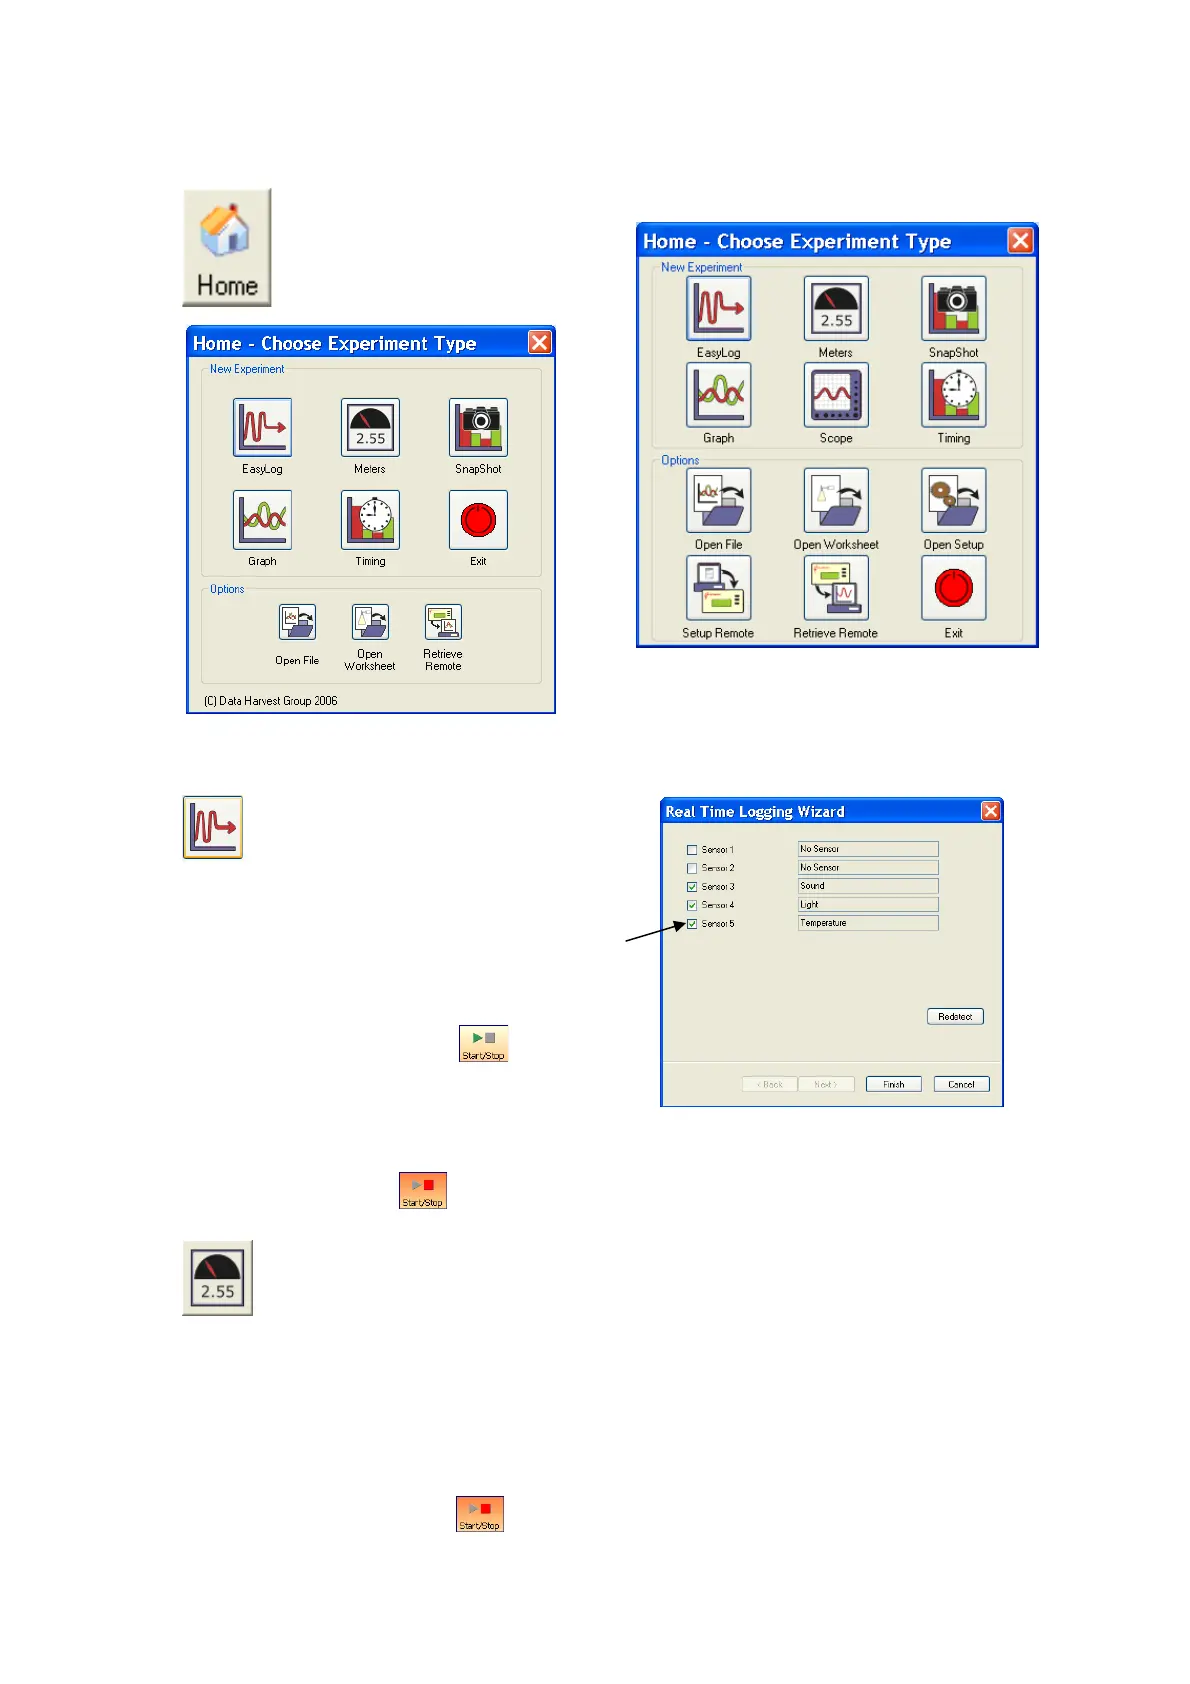
Home is the main navigation
page. On this page are the
icons for all of EASYSENSE
Q’s logging options.
The Home page (Level 2 and 3)
The Home page (Level 1)
EasyLog
EasyLog will open pre-set to record
sensor values continuously as a line
graph until stopped.
A logging wizard will open, deselect the tick
next to any sensors from which readings are
not required and click on Finish.
Click on the Start/Stop icon to begin
recording.
Logging will start with a time span of 30 seconds and when this has elapsed the time
will double automatically. This will continue until the recording is stopped by clicking
on the Start/Stop icon.
Meters
The Meters window gives an introduction to sensors and how they respond to
change. Up to four section displays can be open at any one time and they can
be any combination of sensors and displays.
The program will open with live data from one sensor in a Numeric window. Click on
the appropriate picture icon on the tool bar to open other section displays i.e. Numeric,
Gauge, Colour Change or Bar. To alter the sensor displayed in a section, right click in
the individual section window and select the sensor from the list.
Click on the Start/Stop icon to stop recording.
© Data Harvest Group Ltd.
21