EA Technology UltraTEV Plus
2
Operating Manual 2388L015
Page 14 of 66
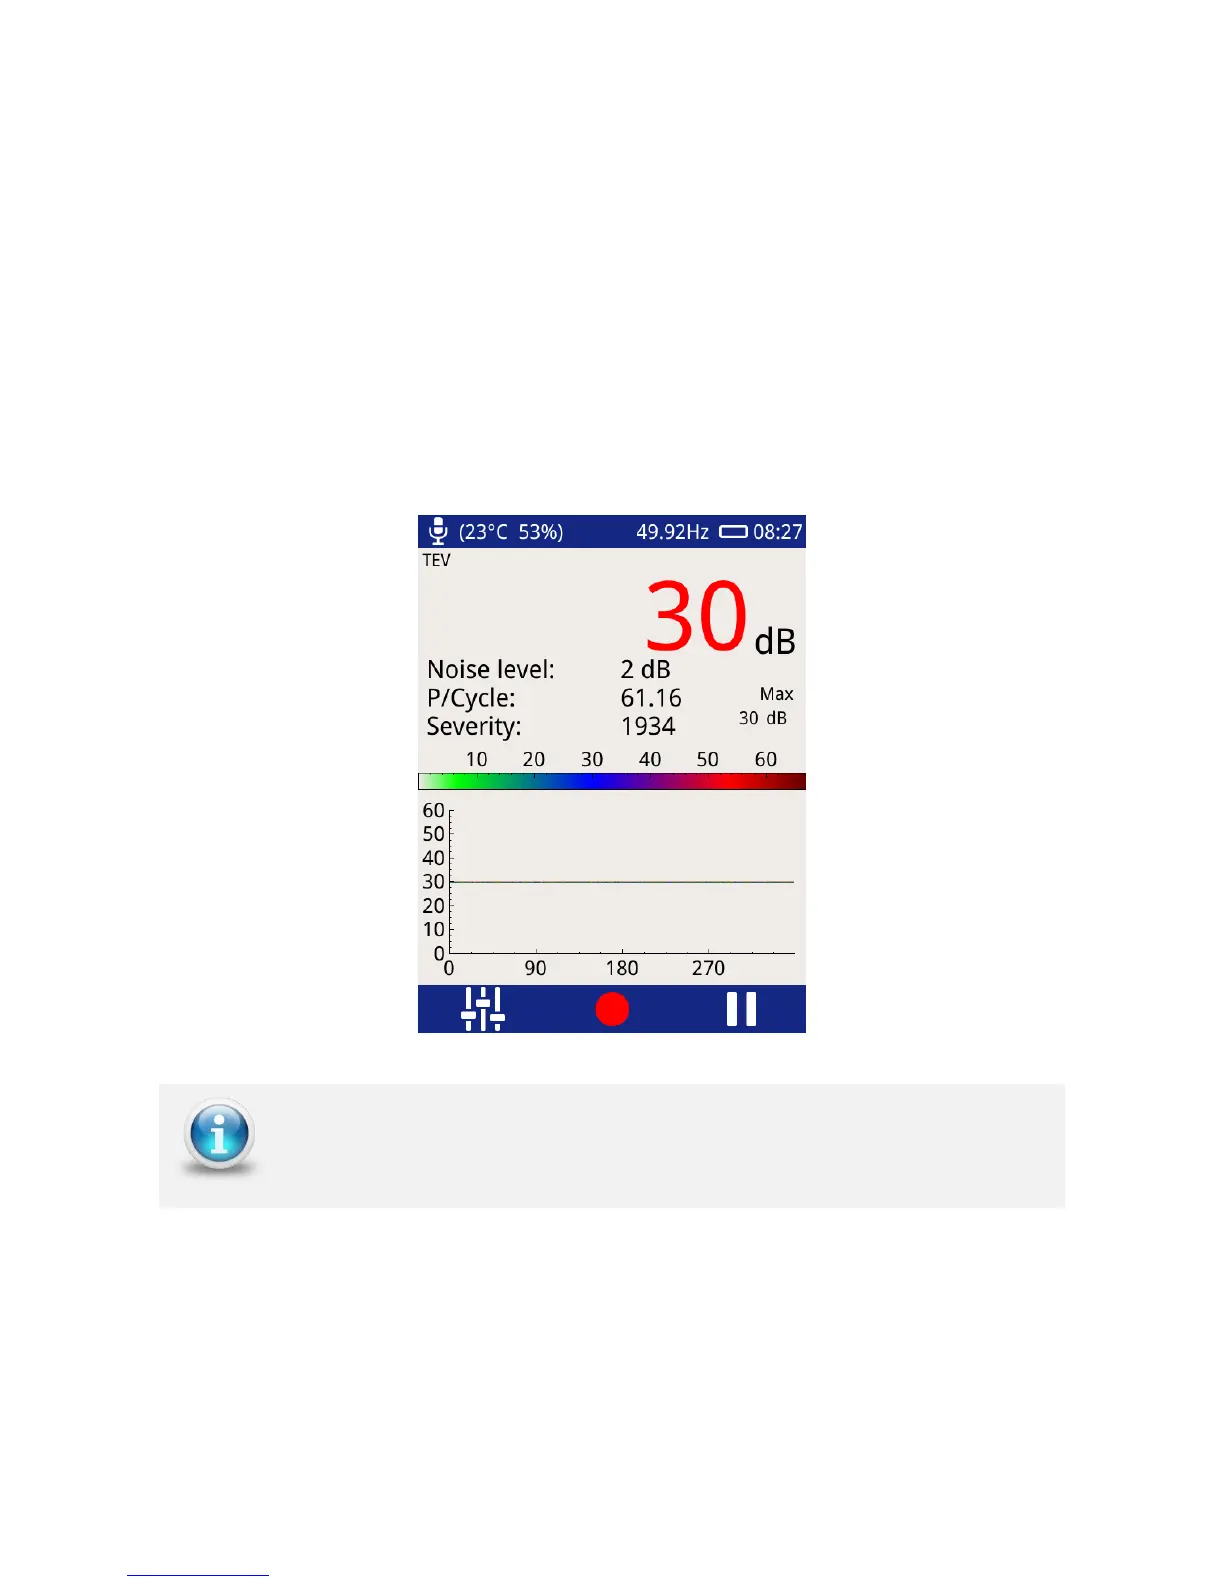
5.6.2 Phase Plot
The Phase Plot mode is common to both TEV and Cable PD. The upper section of the screen
shows measurement values as detailed previously under the ‘Measure Screen’. The lower
section contains a phase resolved intensity plot ‘Phase Plot’ of the measured activity.
The plot displays either TEV or Cable PD events’ phase angles (x-axis) against their
amplitude (y-axis). The colour scale represents the intensity (pulse count) at a given phase
angle and amplitude.
This option is useful for distinguishing between whether a measured PD activity is a
genuine discharge source or just noise. For example, genuine PD activity may manifest
itself as a stable phase resolved plot which will occur at the same position with respect to
phase angle cycle by cycle; whilst white noise will not be phase related occurring at irregular
positions on the phase plot.
The Pause and Record option is also available in this mode; Severity, Noise
Level and P/Cycle are calculated as described under the Measure Screen