EA Technology UltraTEV Plus
2
Operating Manual 2388L015
Page 16 of 66
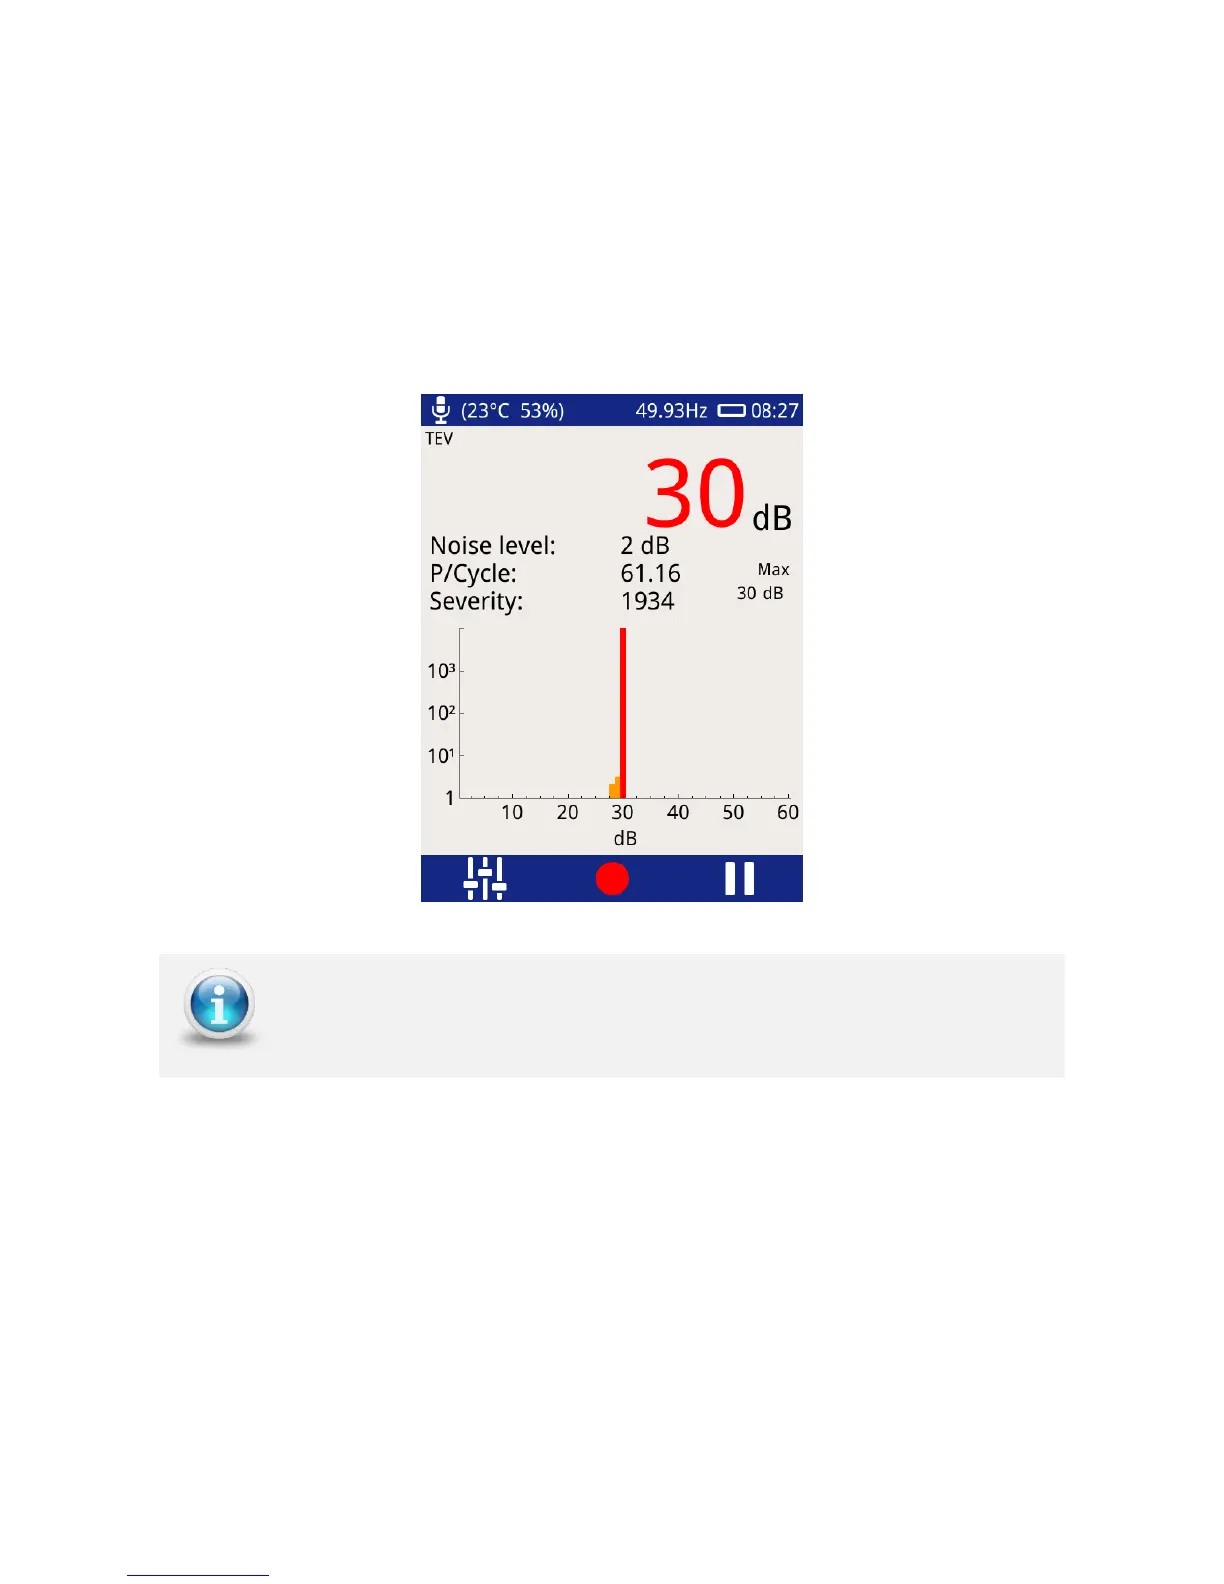
5.6.4 Histogram
This option (shown below) displays the number of events registered (y-axis) for a given
amplitude (x-axis). This measurement option is useful for determining if more than one
discharge source is present; two distinct groups of bars on this chart could mean there are
two sources of discharge at the respective dB (or pC) levels. The screen is also useful in
positively identifying a genuine source of PD and assessing its pulse rate when there is a
high pulse rate noise floor affecting the standard pulse per cycle calculation.
The Pause and Record option is also available in this mode; Severity, Noise
level and P/Cycle are calculated and as described under the Measure Screen