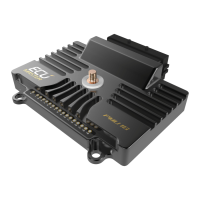
Another diagram example of Fan Output:
CHANNEL LOGGING
Graph Log
PMU Client is equipped with a tool to show channels graph in real time. There are two ways to add
a channel to the graph. First way is to right click on the graph log window, then select Add and type
the channels name. The second way is to select a channel in Output Monitor, Analog Monitor
Variable Selector, or any window from Tree View → Log group, then press Insert keyboard key.
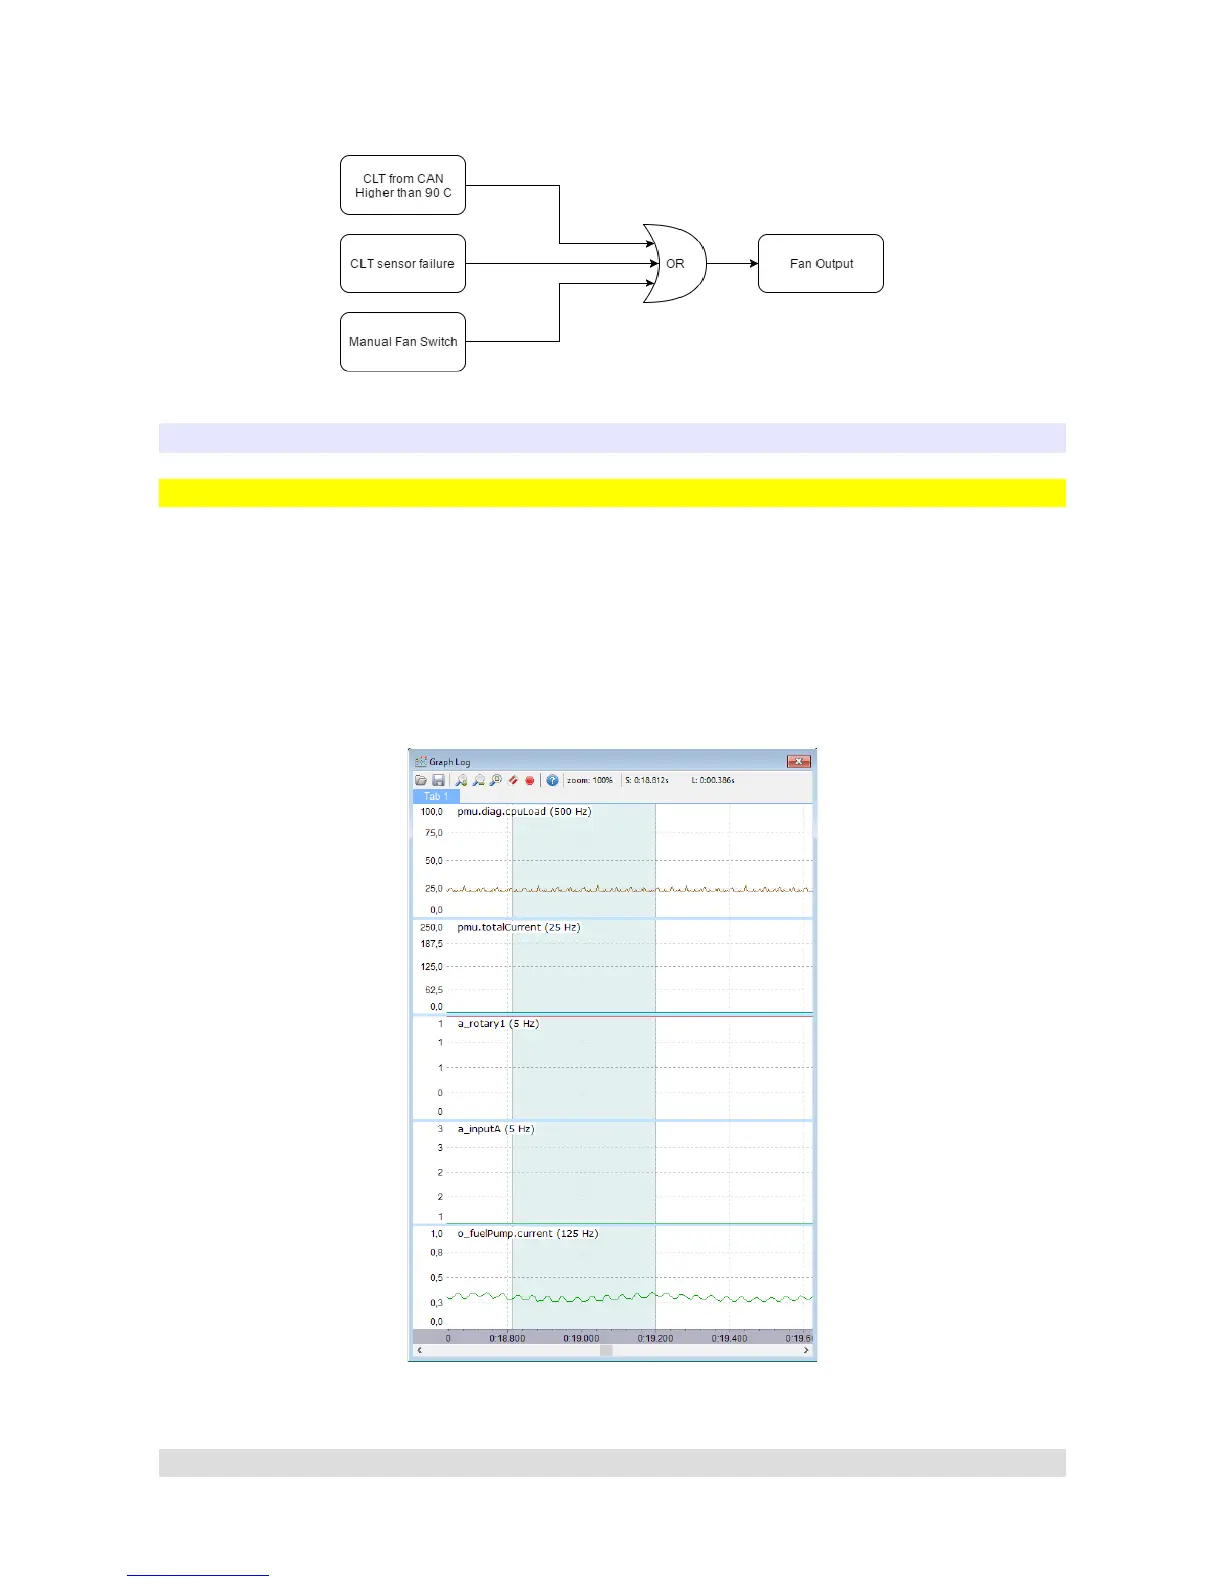
By default two channels are displayed on graph log – the pmu.diag.cpuLoad which displays the
CPU load and the pmu.totalCurrent which displays total current drawn from PMU.
Here is how the Graph Log looks like with few more channels added:
Page 25