29
TECHNICAL DATA AND PERFORMANCES
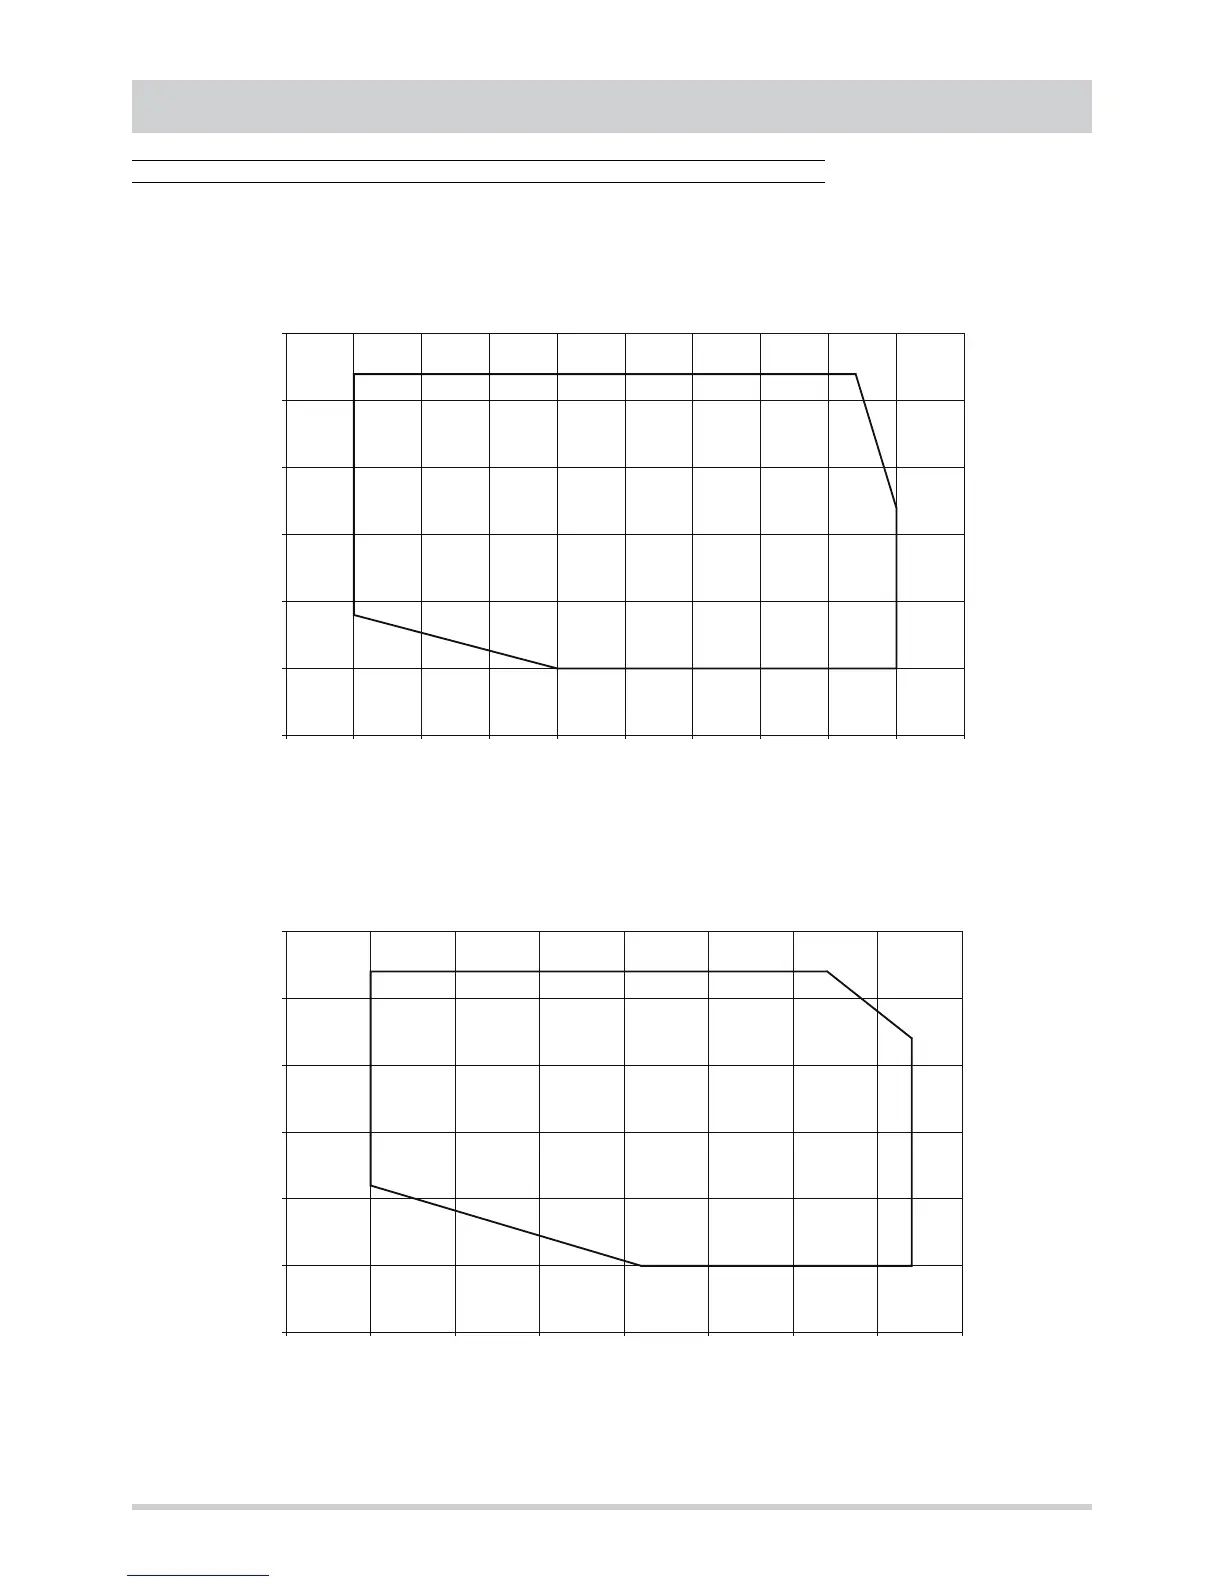
Operating limits
The graphs reported below show the operating area inside which the correct working of the unit is guaranteed.
10
15
20
25
30
35
40
5 10 15 20 25 30 35 40 45 50 55
COOLING
Inlet air temperature d.b - source side [°C]
Inlet air temperature d.b. - plant side [°C]
0
5
10
15
20
25
30
-15 -10 -5 0 5 10 15 20 25
HEATING
Inlet air temperature d.b - source side [°C]
Inlet air temperature d.b. - plant side [°C]
The limits are approximate and are referred to STANDARD air flow rate.