Operating Instructions
Operation
2
2-13
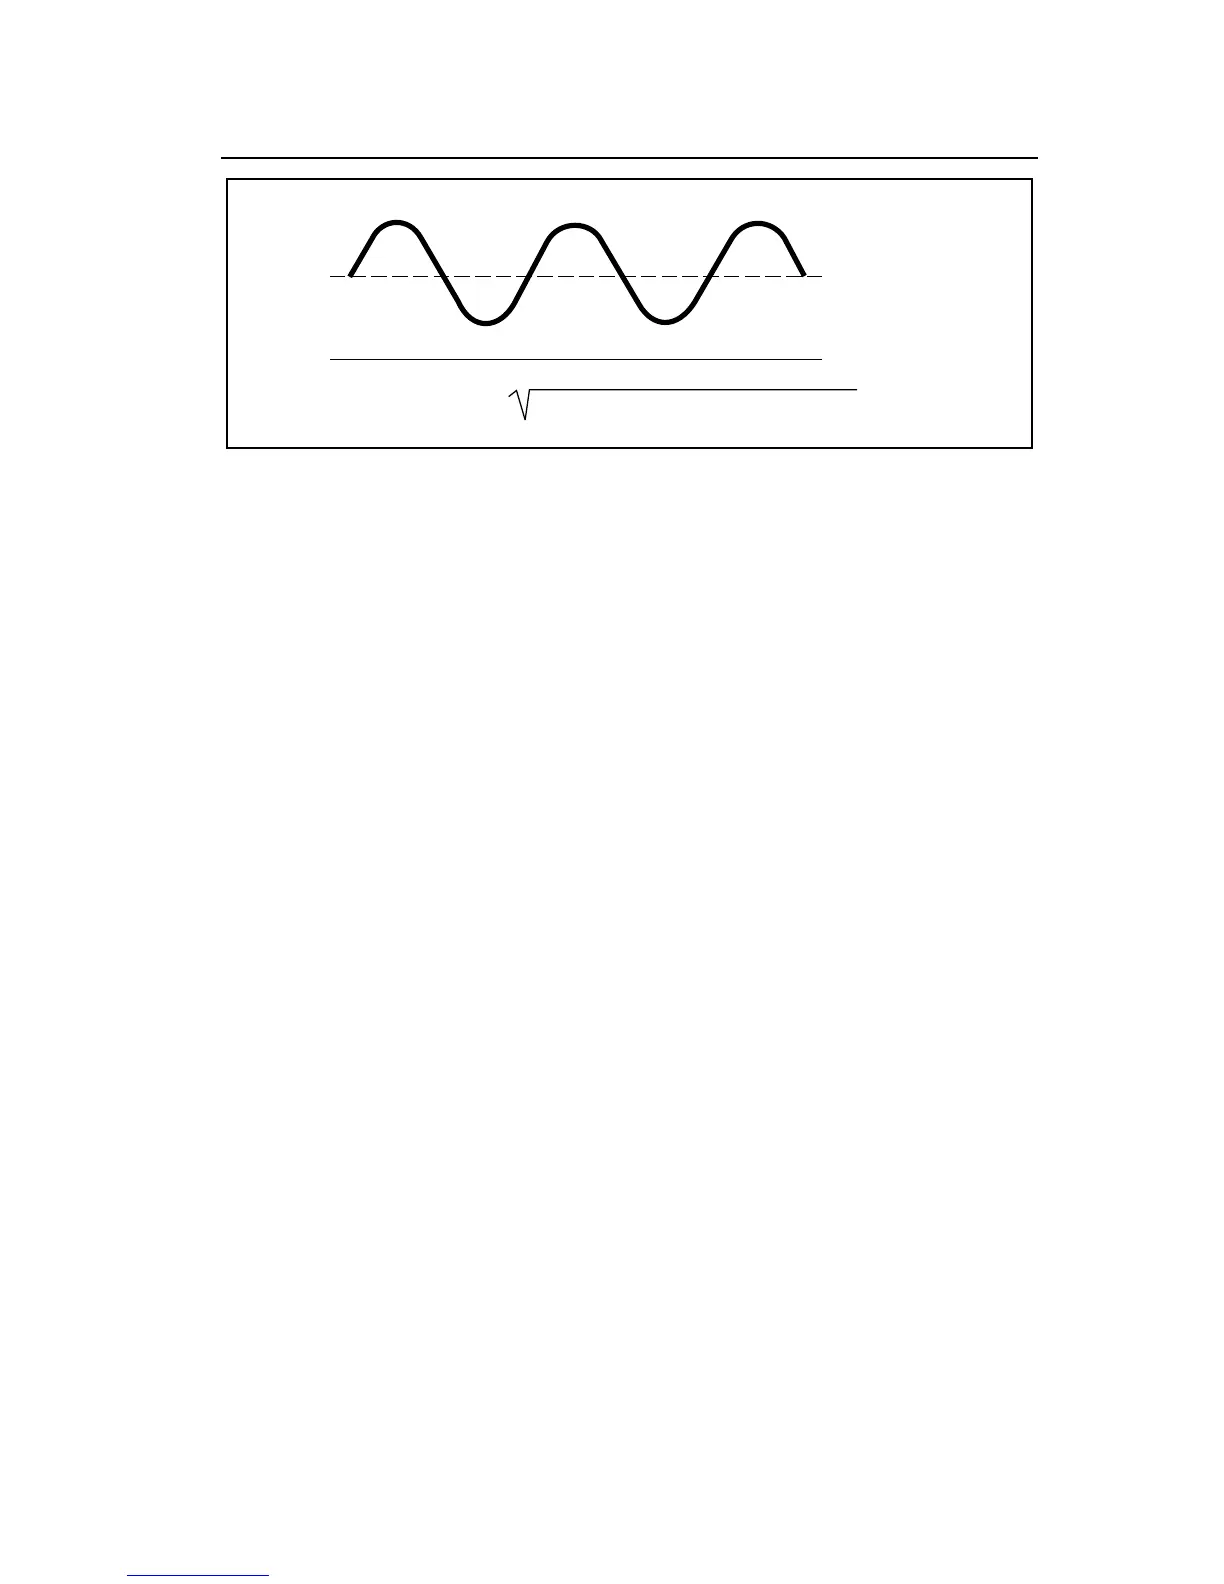
0V
(ac rms component)
2
+ (dc component)
2
RMS Total =
AC Component
DC Component
dx09f.eps
Figure 2-7. AC and DC Waveform Components
2-14. Waveform Comparison and Conversion
Figure 2-8 shows the relationship between common waveforms and the
display readings for the 8060A and average-responding meters. Figure 2-8
also illustrates the relationship between ac and dc measurements for ac-
coupled meters. For example, consider the first waveform, a 1.414V (0-pk)
sinewave. Both the 8060A and the rms-calibrated average-responding meter
display the correct rms reading of 1.000V (the dc component equals 0).
However, consider the 1.414V (0-pk) rectified square wave. Both types of
meters correctly measure the dc component (0.707V). But only the 8060A
correctly measures the ac component (0.707V). The average-responding
meter measures 0.785V, which amounts to a 5.6% error in the total rms
measurement calculated from the ac and dc components.