8 Owner’s Manual for Power Zone Gateway on PZ 410
Installation and Operation
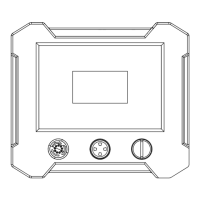
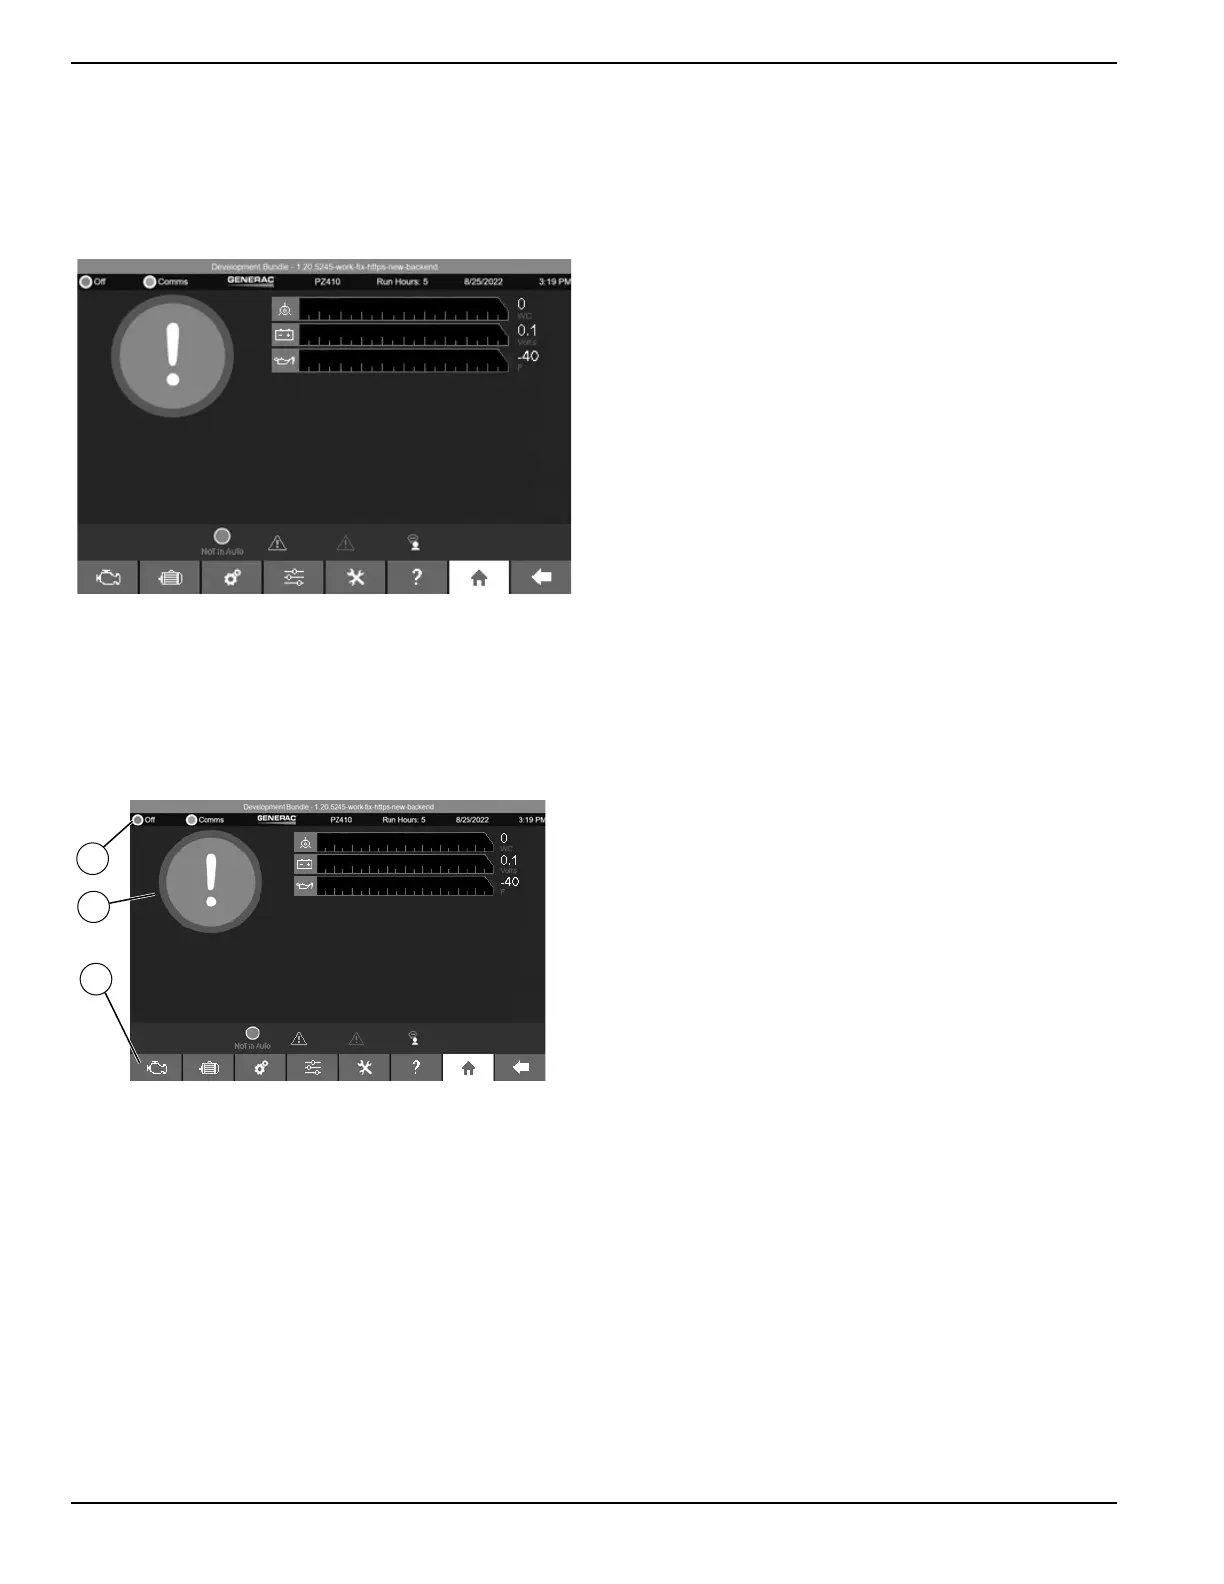
Home Screen
See Figure 3-1. This screen displays bar graphs for the
most common measurements, and an overall health
check for the generator. The number of displayed mea-
surements will change depending on whether or not the
generator is running.
Figure 3-1. Home
Screen Layout
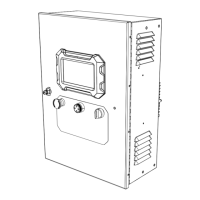
See Figure 3-2. The screen is divided into the Top Ban-
ner (A), the Bottom Banner (B), and the main screen
information area in the center (C). The top and bottom
banners are displayed on every screen.
Figure 3-2. Screen Layout
014621
A
C
B
014621
 Loading...