Owner’s Manual for Power Zone Gateway on PZ 410 11
Installation and Operation
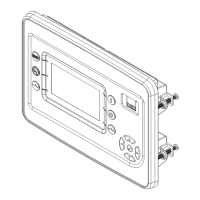
Home Screen Bargraphs
See Figure 3-6. The center of the screen contains data in
the form of bargraphs. The color of the bar changes to
yellow once the measurement triggers a warning (either
high or low). The color of the bar changes to red once the
measurement triggers an alarm. If a measured value
exceeds the bargraph range, the bargraph is outlined in
red.
Figure 3-6. Bargraph
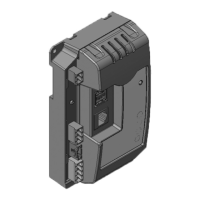
Alarm Ribbon
See Figure 3-7. This area is hidden when there are no
alarms or warnings. If an alarm or warning condition
occurs, a “Ribbon” will be drawn across the lower portion
of the screen showing the condition. Select the icon that
appears to initiate a different action for each icon, as
shown below.
NOTE: The “Check Engine” icon is displayed only for
emissions related Diagnostic Trouble Codes (DTCs).
Normally, these DTCs cannot be cleared manually. They
will clear when the system has met the required condi-
tions for the required length of time or number of run
cycles.
Figure 3-7. Alarm Ribbon
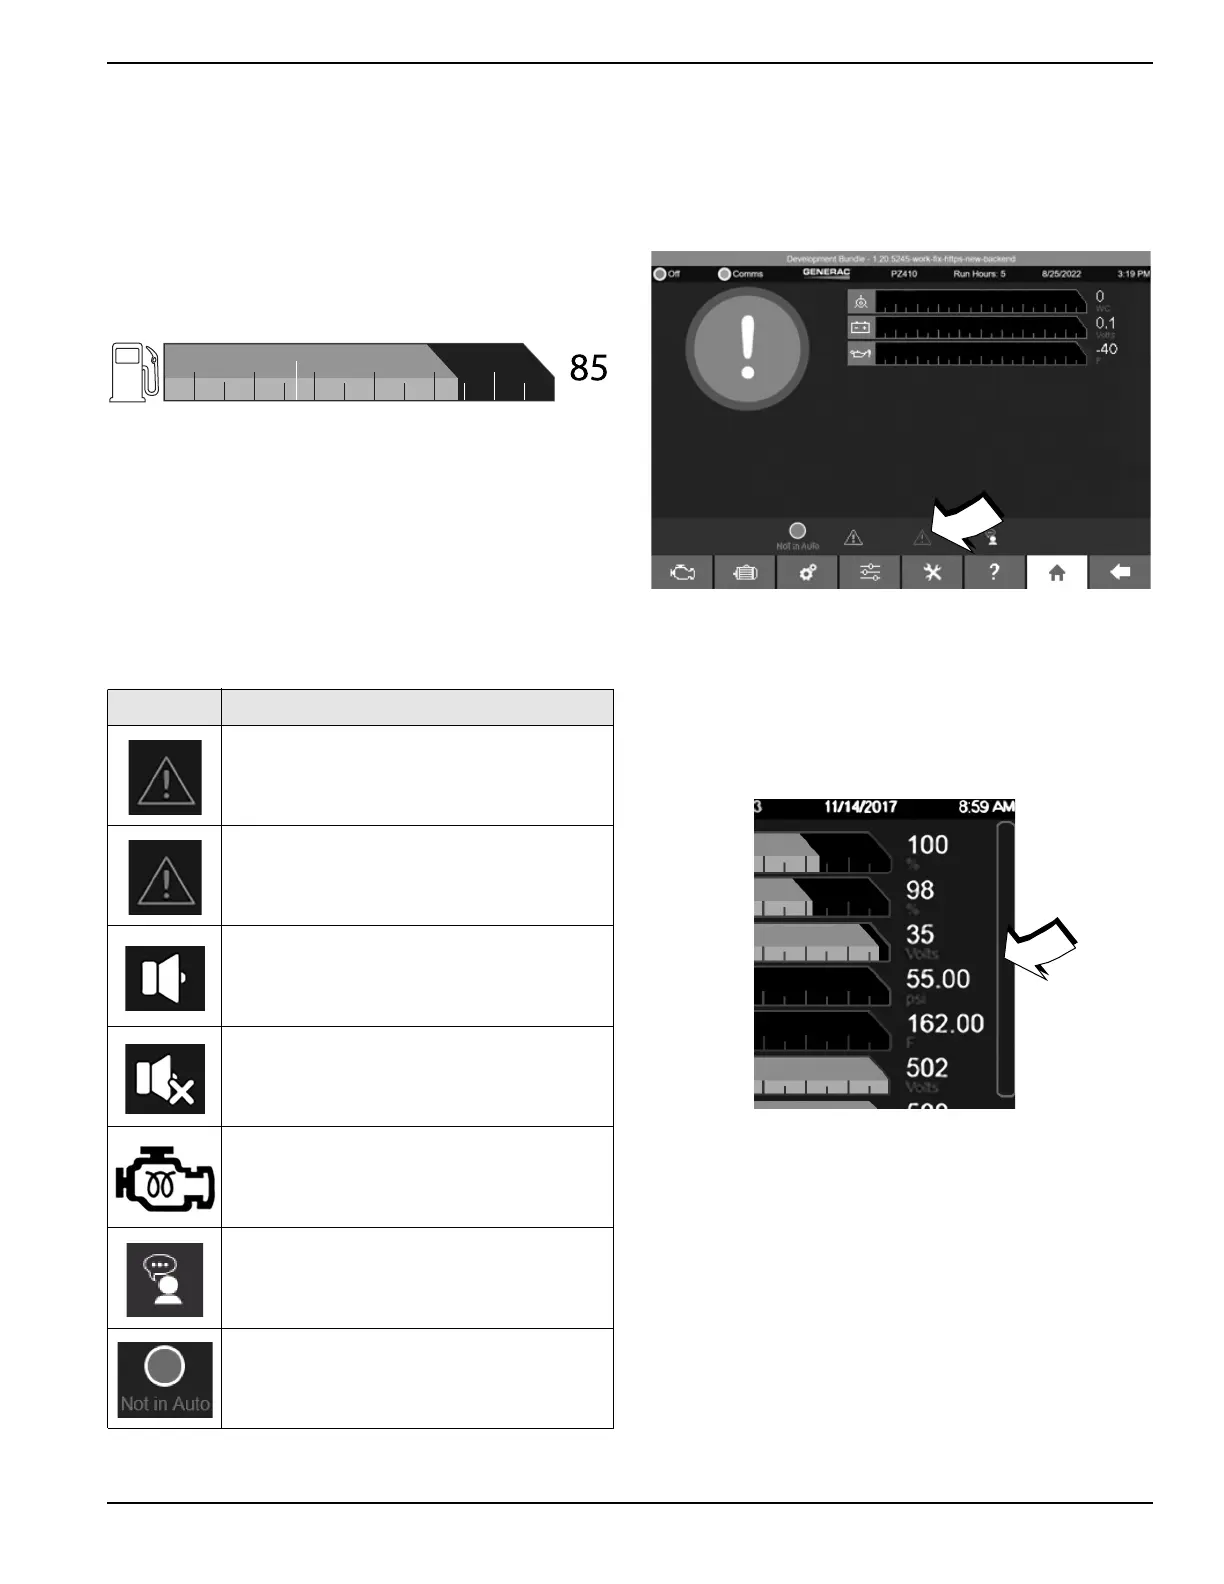
Screen Features
Scrolling
See Figure 3-8. Use a mouse to move the scroll bars.
Figure 3-8. Scroll Bar at Edge of Screen
IIcon Description
Alarm (Red): Displays the Alarms and
Warnings Screen
Warning (Yellow): Displays the Alarms and
Warnings Screen
Alarm Horn Active: Silences the alarm horn
Alarm Horn Silenced: No action
Check Engine: No action
Dealer Information: Displays the dealer
information screen
“Not in Auto” Icon (Red): Displays the
AUTO/OFF/MANUAL screen
007518
014621
007520
 Loading...