6
Details
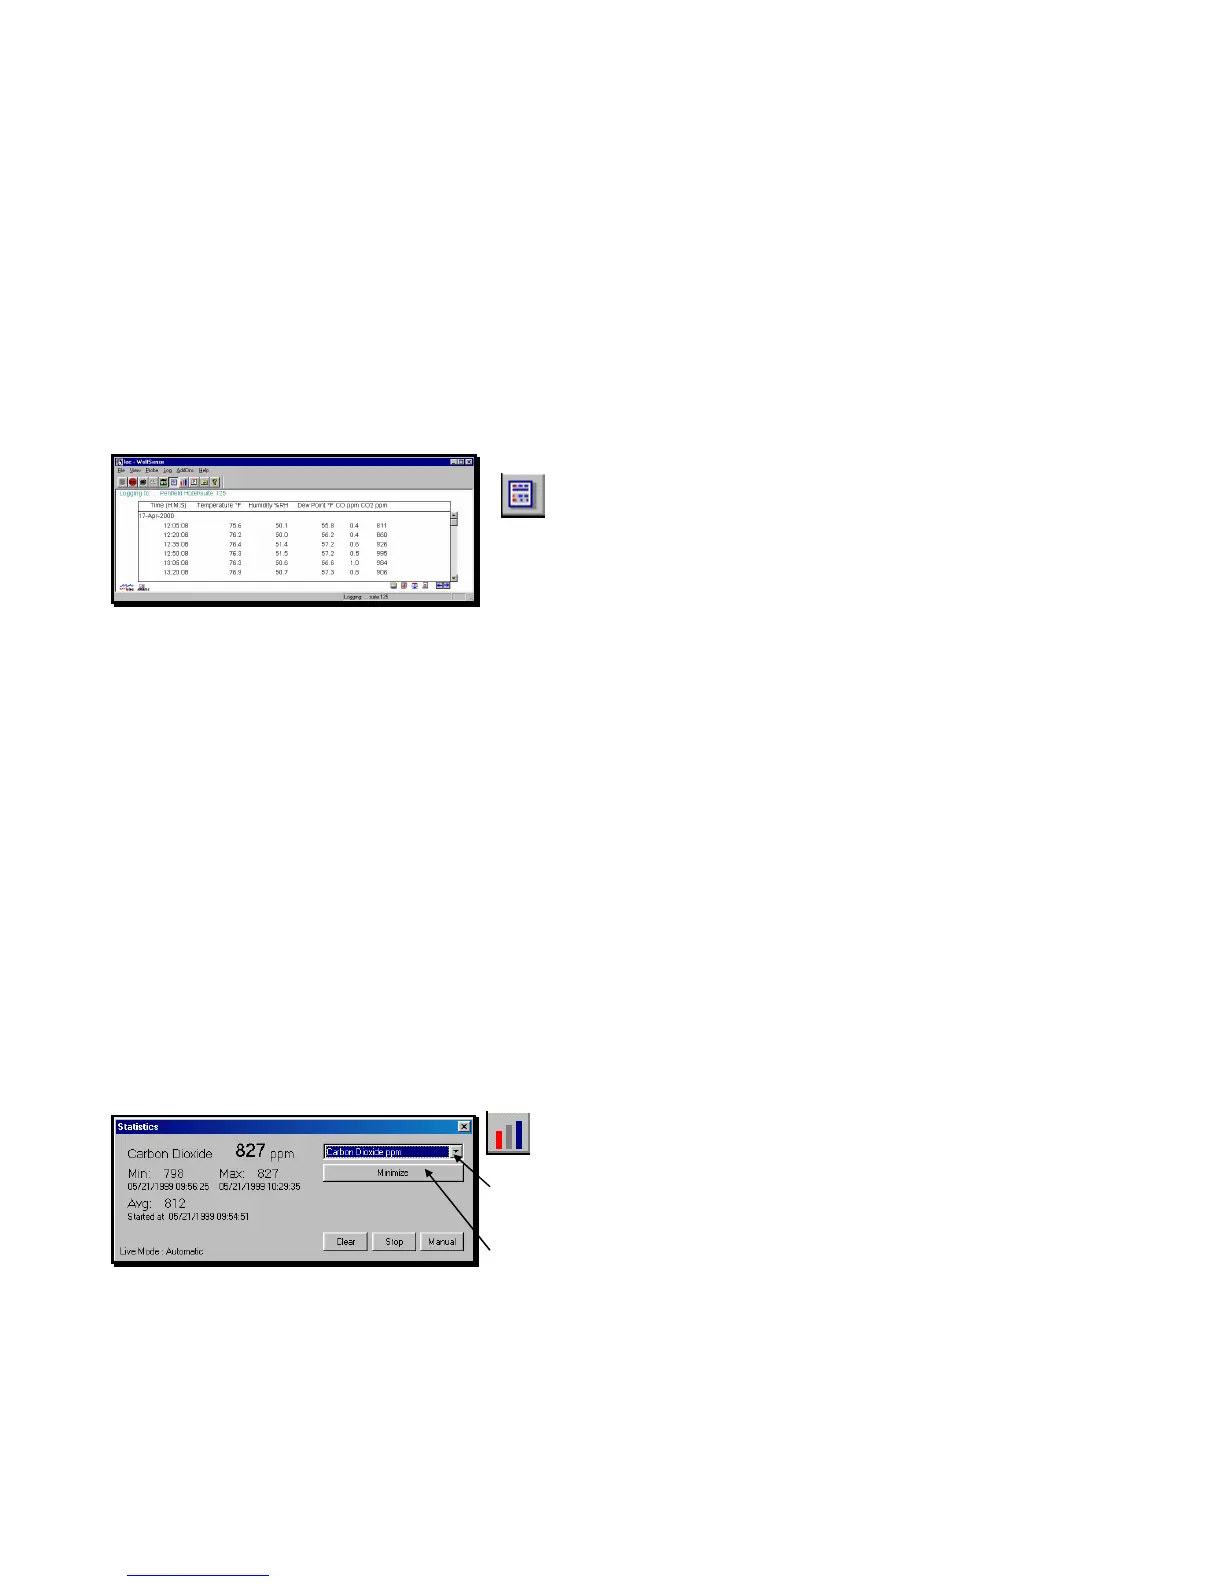
Details allows you to display multiple measurement parameters in columnar format.
This section describes how to view in real time live readings which are updated at
two-second intervals (not user-adjustable). See “Stored Readings” on page 13 for
information on viewing data that has been logged into location files at user-selected
intervals.
To see continuously updated live values
from the probe, click on or tap the Details toolbar
button or View, Details.
The table displays columns based on parameters
chosen for display in View, Readings.
Statistics
The Statistics window displays the minimum, maximum and average readings for a
single parameter in a separate window that may be minimized and kept on the
screen.
The Manual/Auto button toggles between Automatic and Manual modes.
In Auto mode, readings taken from the probe at two-second intervals update the
minimum and maximum values, and are automatically added to the readings used to
calculate the average. The Stop/Resume button lets you stop and resume readings
in Auto mode.
In Manual mode, click on or tap Add to add readings manually to the tally of readings
included in the statistics calculations for the chosen parameter.
Clear resets the minimum, maximum and average to zero.
Click on or tap the Statistics toolbar button
or View, Statistics.
To choose a different parameter for display,
click on or tap the pull-down menu arrow.
Click on or tap the new parameter.
Click on or tap Minimize to shrink the window and
keep it on display.
Figure 7 - Live Mode - Details (DirectSense 100)
Figure 8 - STATISTICS dialog box in Auto mode