7
Graph
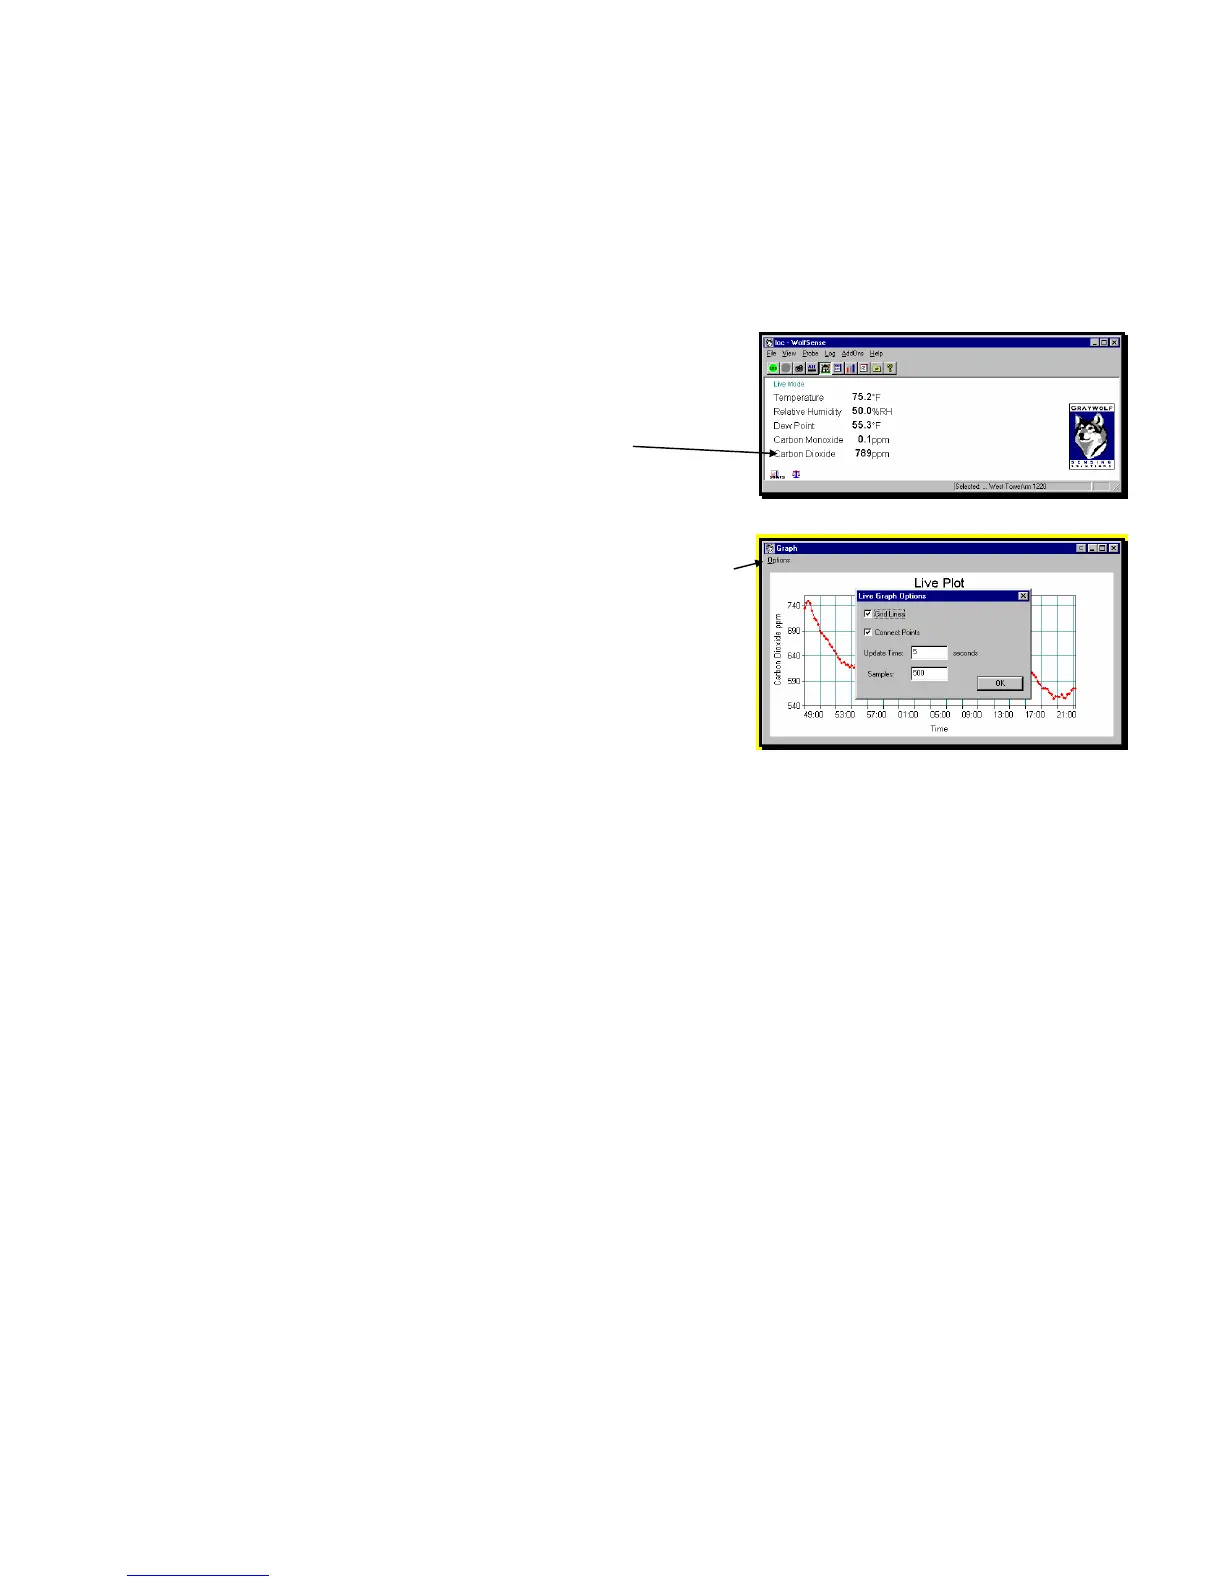
Graph allows you to plot readings for a selected measurement parameter in real time
from Live Mode, Readings.
To see current values from the probe,
click on or tap View, Readings.
To choose the parameter you want to graph,
click on or tap the desired parameter.
Click on or tap View, Graph.
Click on or tap Options to change the appearance of
the graph:
Check Grid Lines to display gridlines;
Check Connect Points to draw lines between
points;
Set Update Time in seconds;
Set the number of Samples to be taken.
Data Organization: Sites and Locations
Logged readings are stored in individual data files called location (.loc) files.
Calibration data, text notes, drawing notes, and template reports are also stored and
organized as attachments to these location files (see “Notebook” on page 13).
Location files are stored in the Windows folder which WolfSense calls site folders or
Sites. WolfSense IAQ LAP and WolfSense PC software use the same Windows file
structure of site folders and location files on the Lap PC. If you create a location file
in WolfSense IAQ LAP, you will be able to open it from WolfSense PC.
Each site folder may contain multiple sub-sites and multiple location files to further
organize the data. For example, a site folder called "School" may have one sub-site
for the "Ground Floor" containing locations for the "Principals Office" and "Library"
and another sub-site called "3rd Floor" containing a location for the "Teachers
Lounge." The root site in the WolfSense file system is \My Documents\WolfSense\,
so the three location files would have these file names:
\My Documents\WolfSense\School\Ground Floor\Principals Office.loc
\My Documents\WolfSense\School\Ground Floor\Library.loc
\My Documents\WolfSense\School\3rd Floor\Teachers Lounge.loc
Figure 9 – LIVE MODE READINGS
Figure 10 – GRAPH Readings in Real Time