60
LOGGING
5. Press ESC key to return to the menu.
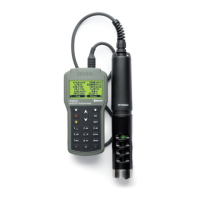
6. Press Plot, and the meter will create a list with all available parameters that can be plotted.
7. Use the arrow keys to select the parameter to be plotted. Press Select to view the graph.
8. Use the arrow keys to move the cursor in the graph and highlight a sample. The sample data is
displayed below the graph.
9. Press ESC key to return to the parameter list.
Note: The number of lot samples that can be plotted is limited by the display resolution. To view
a complete graph download data to PC.
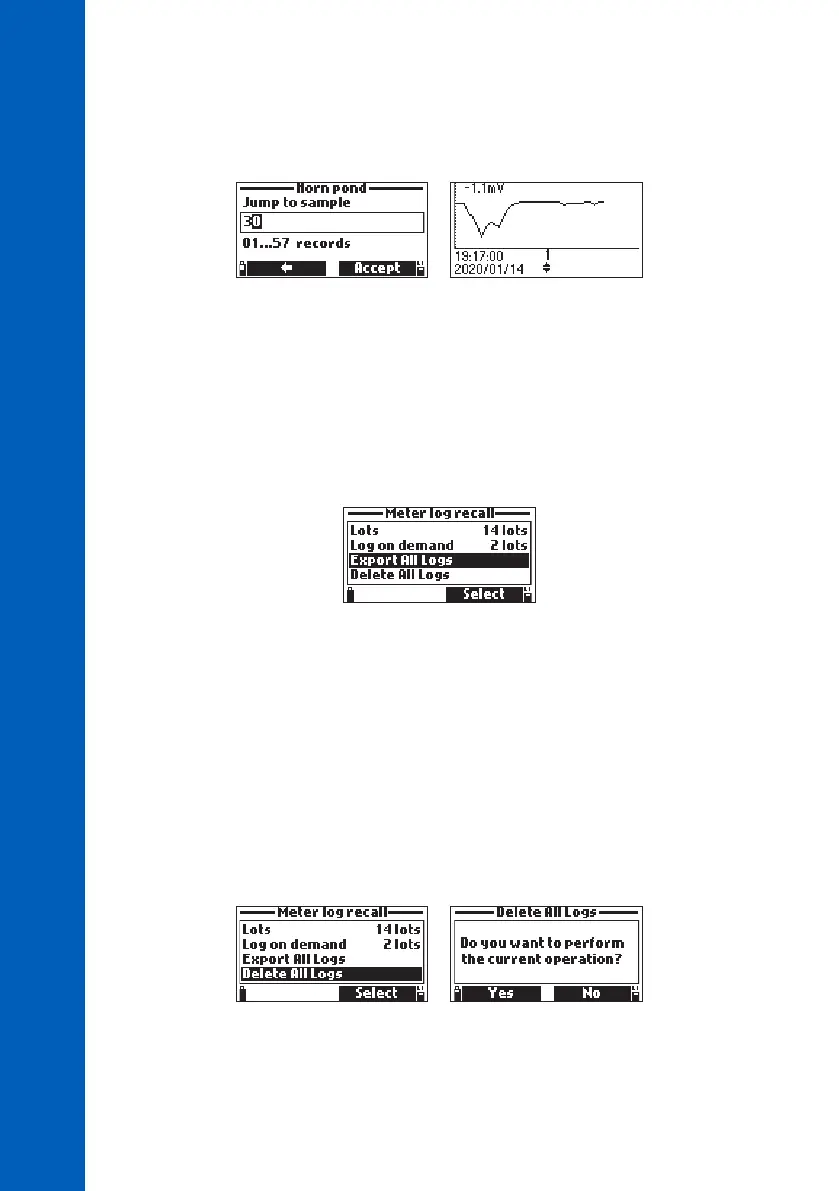
Export All Logs
Select this option to export all logs to a PC.
Export all logged data to USB-C Flash Drive:
1. Insert a USB-C flash drive (or USB-A with cable adapter) into the USB-C connector located on
the top of meter. See section 13.5. PC CONNECTION for details to transfer files to a PC directly.
2. Select Export All Logs
Connecting will be displayed followed by the file transfer information.
When all files have been transferd, “File transfer completed” message will be displayed.
Delete All Logs
When this option is selected the instrument will ask for confirmation.
Press Yes to delete or No to return to the previous screen.
To return to the “Log Recall” menu, press ESC key.
 Loading...