MAN-08723-001 Rev. 001 page 11 of 28
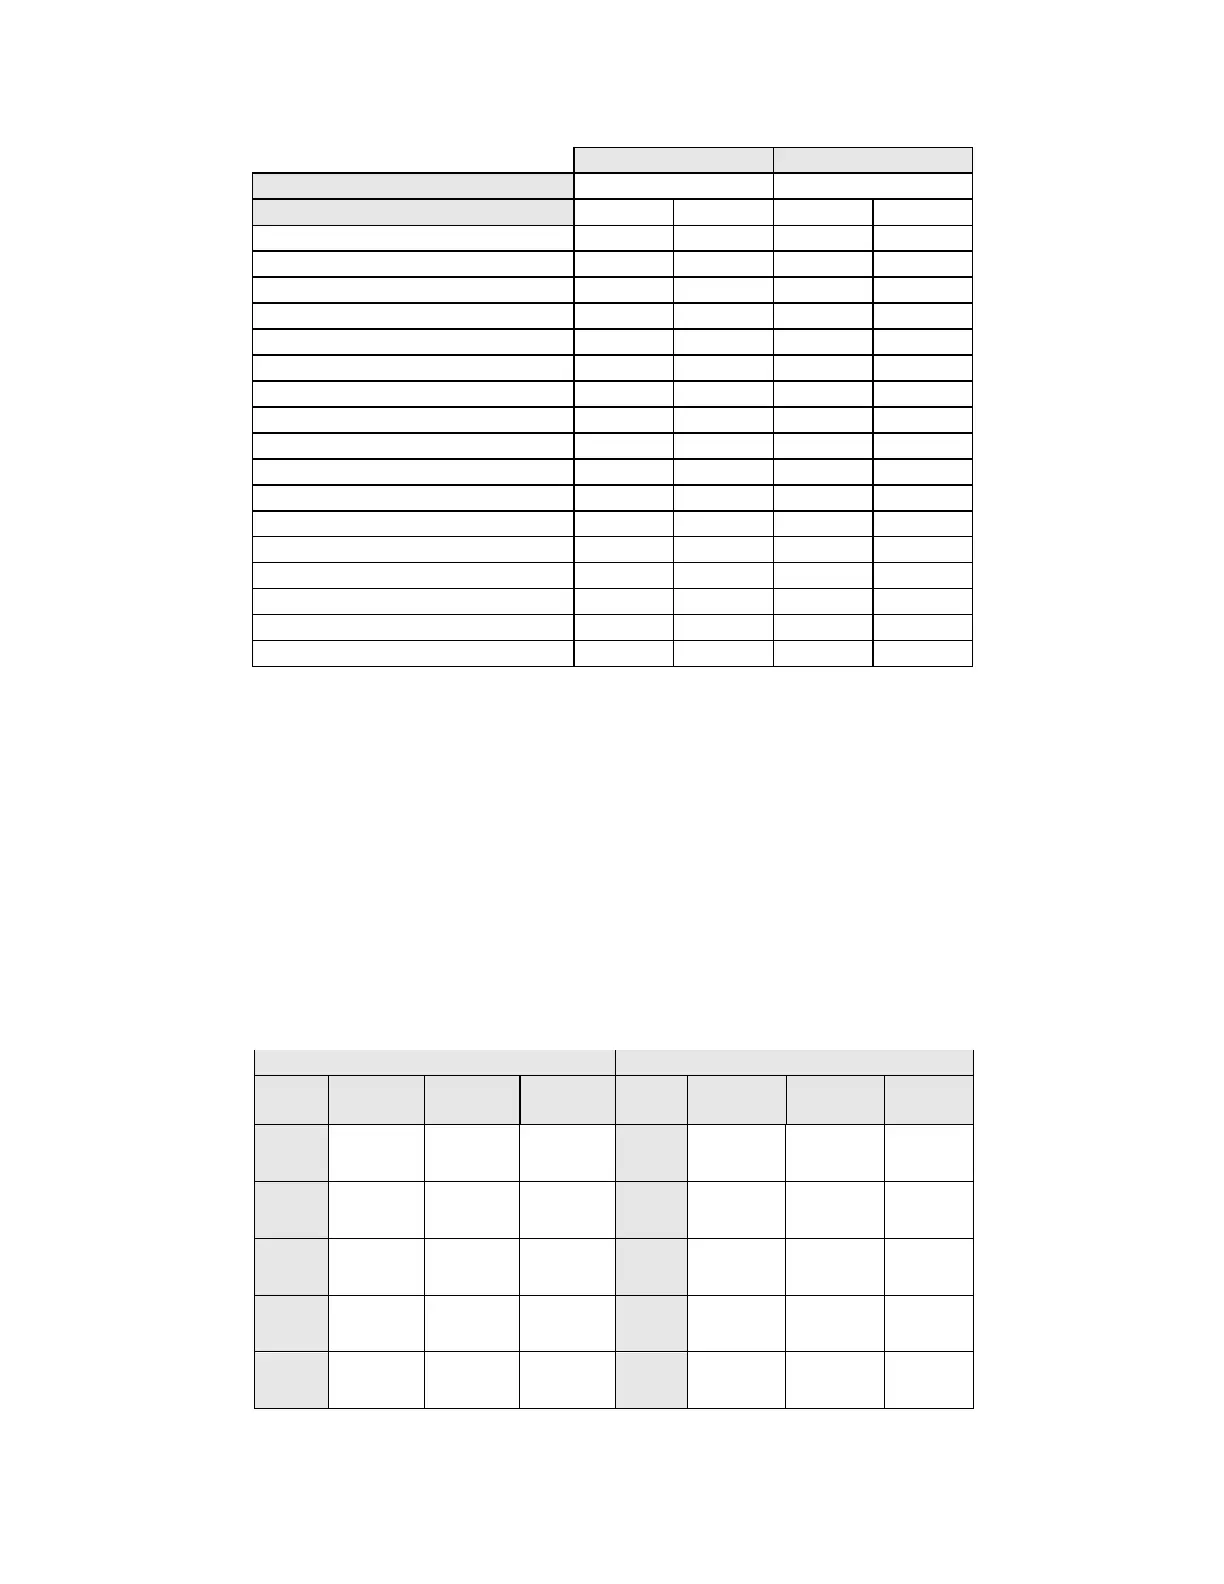
Table 12: Unadjudicated Marginal Frequencies Summary of Specimen Adequacy
Results – All Sites Combined.
Manual Review Imager Review
Number of Patients:
9627 9627
Descriptive Diagnosis
N
%
N
%
Satisfactory for Evaluation
7375 76.6 7346 76.3
Satisfactory but Limited by
2186 22.7 2252 23.4
Endocervical Component Absent 1196 12.4 1397 14.5
Scant Squamous Epithelial Component 92 1.0 102 1.1
Obscuring Blood 45 0.5 17 0.2
Obscuring Inflammation 69 0.7 68 0.7
No Clinical History 982 10.2 933 9.7
Cytolysis 4 0.0 2 0.0
Other 6 0.1 33 0.3
Unsatisfactory for Evaluation
66 0.7 29 0.3
Endocervical Component Absent 6 0.1 0 0.0
Scant Squamous Epithelial Component 35 0.4 22 0.2
Obscuring Blood 17 0.2 2 0.0
Obscuring Inflammation 8 0.1 5 0.1
No Clinical History 2 0.0 2 0.0
Cytolysis 0 0.0 0 0.0
Other 2 0.0 0 0.0
Note: Some patients had more than one diagnostic subcategory.
For SAT cases, there was agreement between the Manual Review cases (7375) and the Imager
Review cases (7346). For SBLB cases, there is agreement between the Manual Review cases (2186)
and the Imager Review cases (2252). Unsatisfactory cases were greater in the Manual Review cases
(66) versus the Imager Review cases (29).
The adjudicated results were used as a “gold standard” to define “true” specimen adequacy
classifications of the Bethesda System: SAT/SBLB and UNSAT. There were 58 “true” UNSAT
cases and 9569 “true” SAT/SBLB cases.
Table 13 below summarizes specimen adequacy performance for the Imager Review and Manual
Review arms for all four sites and all sites combined using the Bethesda System 1991 criteria.
Table 13: Adjudicated Review Versus Imager Review Specimen Adequacy
Summary for All Sites and All Sites Combined.
Sensitivity is a percent of “true” UNSAT slides classified in either study arm as UNSAT and specificity is a percent of
“true” SAT/SBLB slides classified in either study arm as SAT/SBLB.
Sensitivity Specificity
Site/
Number
Cases
Manual
Imager
Difference
Site/
Number
Cases
Manual
Imager
Difference
Site 1
0% 0% 0.0%
Site 1
100% 100% 0.0%
21
(0/21) (0/21) (0/21)
2292
(2292/2292) (2292/2292) (0/2292)
Site 2
100% 16.7% -83.3%
Site 2
98.9% 99.6% +0.6%
6
(6/6) (1/6) (-5/6)
2476
(2449/2476) (2465/2476) (16/2476)
Site 3
80.0% 60.0% -20.0%
Site 3
99.2% 99.7% +0.5%
5
(4/5) (3/5) (-1/5)
2323
(2304/2323) (2315/2323) (11/2323)
Site 4
30.8% 19.2% -11.5%
Site 4
99.9% 99.9% +0.04%
26
(8/26) (5/26) (-3/26)
2478
(2475/2478) (2476/2478) (1/2478)
All
58
CI*
29.3%
(17/58)
(18.1, 42.7)
13.8%
(8/58)
(6.1, 25.4)
-15.5%
(-9/58)
(-25.9, -5.0)
All
9569
CI*
99.5%
(9520/9569)
(99.3, 99.6)
99.8%
(9548/9569)
(99.7, 99.9)
+0.3%
(28/9569)
(0.2, 0.4)
*95% Confidence Interval