MAN-08723-001 Rev. 001 page 13 of 28
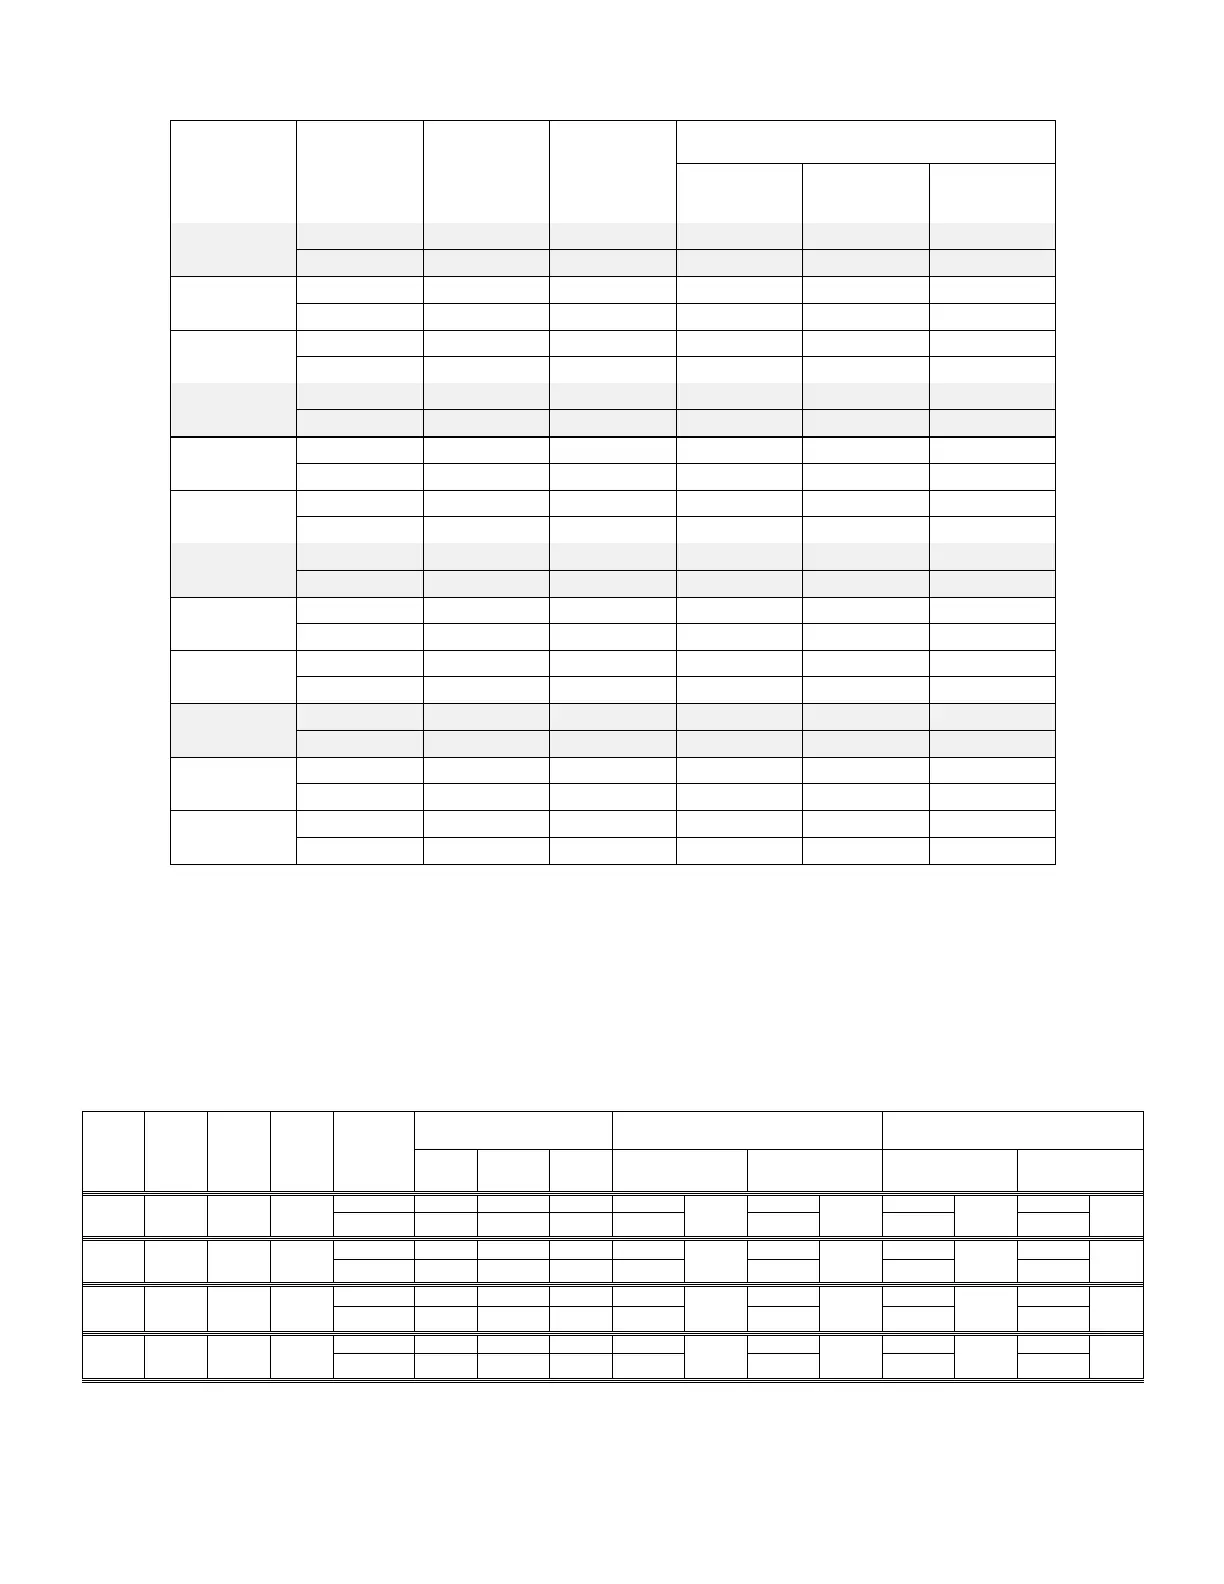
Table 14: Cytotechnologist Screening Rates
Site/CT
Review
Methods
Total
Number of
Slides
Evaluated
Average
Number of
Hours
Screened Per
Da
Extrapolated Daily Rates
(8-hour workday)
Low
Day
Average
Day
High
Day
Site 1
Manual 2568 7.4 49 69 94
Imager 2297 6.0 107 153 206
1-1
Manual 1284 7.5 49 60 72
Imager 1168 6.1 117 153 182
1-2
Manual 1284 7.3 70 78 94
Imager 1129 5.9 107 154 206
Site 2
Manual 2686 7.7 40 68 80
Imager 2665 7.8 69 109 131
2-1
Manual 1348 7.6 40 71 80
Imager 1309 7.9 97 110 118
2-2
Manual 1338 7.8 55 66 75
Imager 1356 7.7 69 109 131
Site 3
Manual 2738 7.9 20 80 101
Imager 2726 4.5 148 204 320
3-1
Manual 1368 7.9 63 82 91
Imager 1460 4.2 167 230 320
3-2
Manual 1370 7.8 20 78 101
Imager 1266 4.7 148 178 212
Site 4
Manual 2612 7.6 42 69 94
Imager 2524 5.1 86 138 198
4-1
Manual 1305 8.2 59 75 84
Imager 1252 5.1 86 150 190
4-2
Manual 1307 6.9 42 63 94
Imager 1272 5.0 109 126 198
Table 15 summarizes the Manual Review versus the Imager Review for ASCUS+ and HSIL+
sensitivity and specificity by site. The table also presents the prevalence of ASCUS+, LSIL+, and
HSIL+ among the reviewed slides and the respective screening daily rates of each review method.
The daily screening rates are extrapolated to an 8-hour workday and are presented as the low,
average and high daily screening rates by site.
Table 15: Screening Rates, Prevalence of ASCUS+, LSIL+, HSIL+, and Respective
Performance for ASCUS+ and HSIL+.
Site % of
ASCUS+
% of
LSIL+
% of
HSIL+
Review
Methods
Extrapolated Daily Rates
(8-hour workday)
Performance for
ASCUS+
Performance for
HSIL+
Low
Day
Average
Day
High
Day
Sensitivity Specificity Sensitivity Specificity
Site 1 7.7% 4.5% 1.6%
Manual 49 69 94 77.2%
+1.1%
98.7%
+0.4%
89.5%
+2.6%
98.8%
+0.7%
Image
107 153 206 78.3% 99.2% 92.1% 99.5%
Site2 9.2% 4.0% 1.6%
Manual 40 68 80 63.1%
+14.4%
95.8%
+0.3%
72.5%
-2.5%
99.8%
-0.1%
Image
69 109 131 77.7% 96.1% 70.0% 99.6%
Site 3
4.4% 2.7% 1.0%
Manual 20 80 101 80.6%
+13.6%
98.5%
+0.4%
64.3%
+13.6%
99.7%
0%
Imager 148 204 320 94.2% 98.8% 78.6% 99.7%
Site 4 7.2% 4.5% 1.6%
Manual 42 69 94 87.2%
-2.8%
97.3%
-0.3%
61.5%
+12.8%
99.5%
+0.3%
Imager 86 138 198 84.4% 97.0% 74.4% 99.8%
The clinical study data show that the screening rates achieved with the ThinPrep
®
Imaging System
resulted in sensitivity or specificity values that fall within acceptable limits.