Now consider the same waveform at 200
µ
s/div. All that remains is the
signal’s maximum and minimum values. This could lead you to believe the
signal transitioned very infrequently because of the lack of any intermediate
signal values.
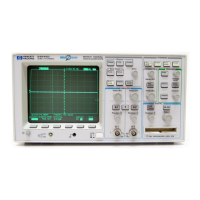
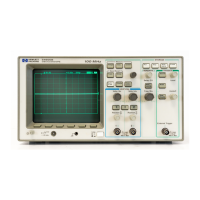
Same Square Wave in Peak Detect Mode at 200
µ
s/div on HP 54600
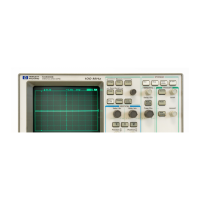
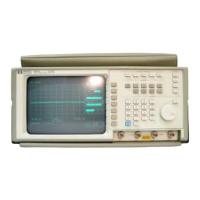
The HP 54645A/D goes one step further in peak detect mode. In addition to
the maximum and minimum values, the HP 54645A/D includes some “normal”
or dithered samples. Note the same picture at 200
µ
s/div on the HP 54645A/D
as shown above.
Figure 4-4
MegaZoom Concepts
Display Modes
4-12