Graphical view of library
The graphical view of the library the shows graphical representation of the library and library components, such as tape drive, cartridges, cartridge magazine,
accessor, and Ethernet.
Configuring the library
Graphical view of library
The graphical view of the library the shows graphical representation of the library and library components, such as tape drive, cartridges, cartridge magazine, accessor,
and Ethernet.
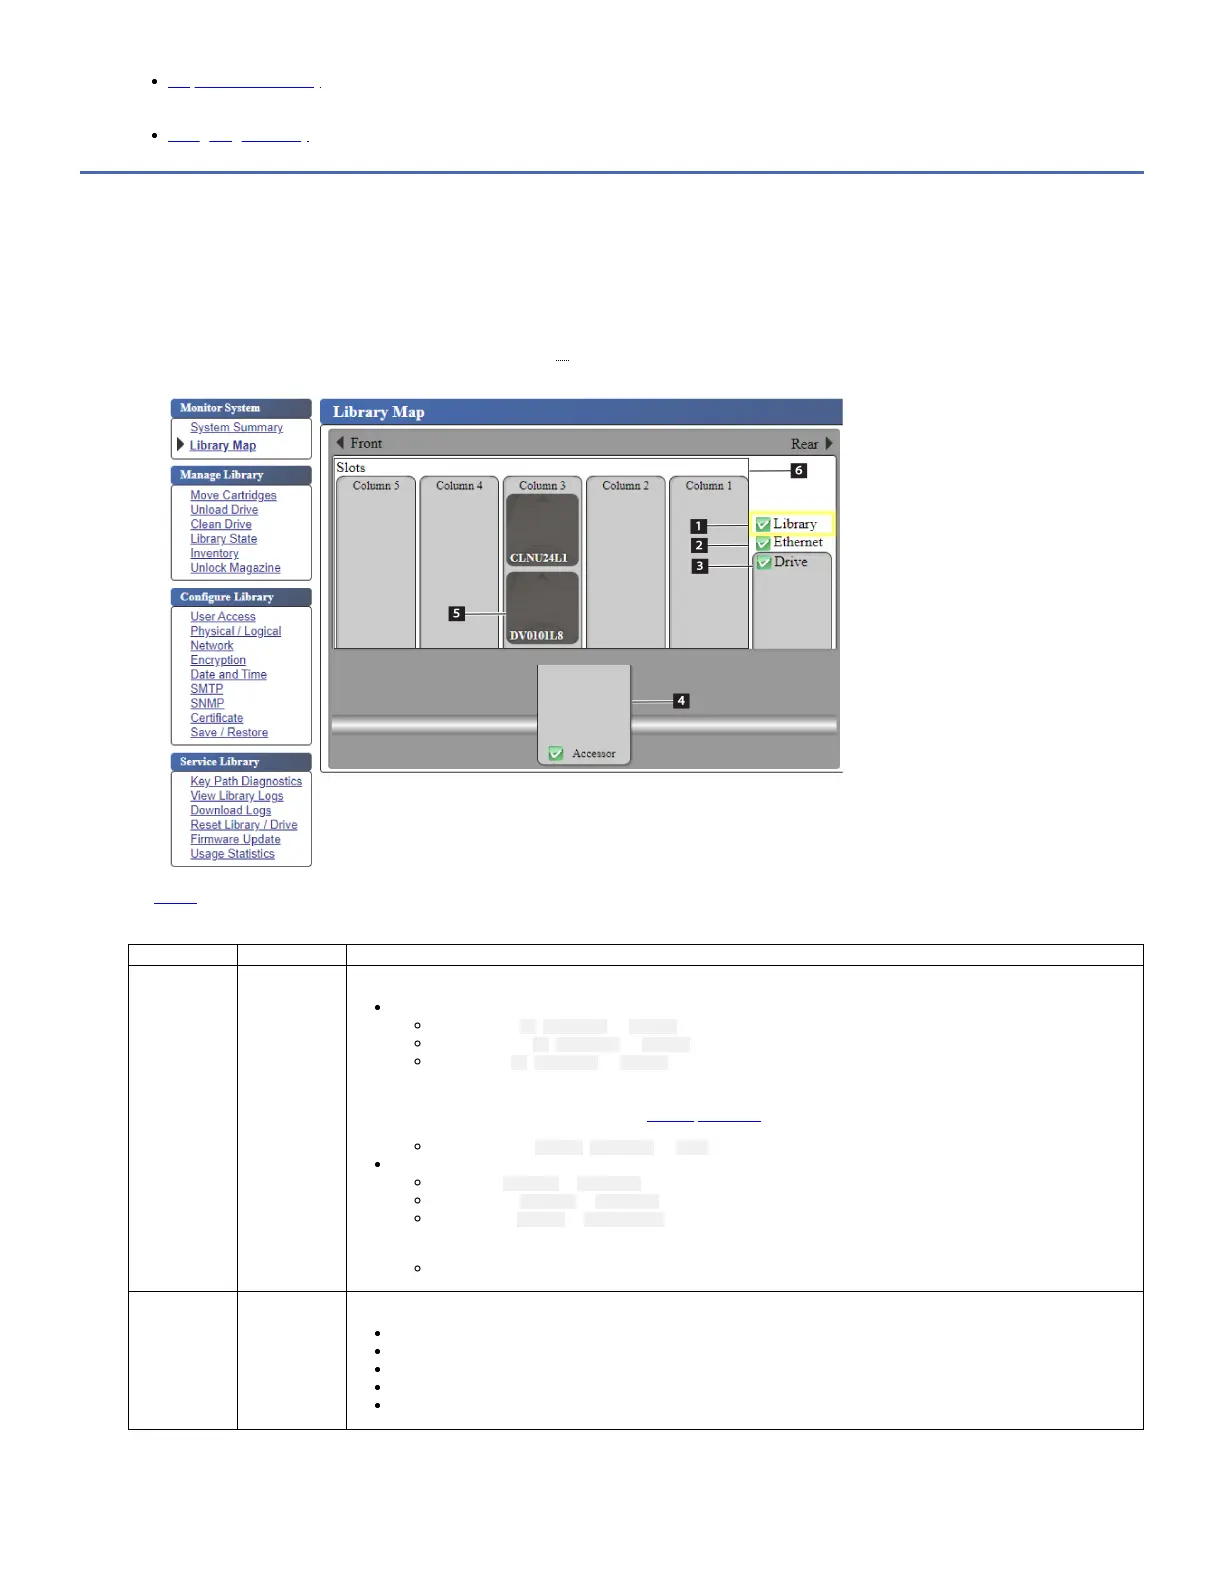
Each component of the library is represented by a clickable icon. Select a component to view the detailed information for that component of the library on the right side of
the page. A grayed-out column represents the I/O station.
To view the graphical representation of the library, go to Monitor System > Library Map.
Figure 1. Graphical view of the library
The Table 1 shows the information according to the type of component selected.
Table 1. Library components and status
Component Status
1 Library Displays the Unit status and Library settings:
Unit Status
Library status (OK, Degraded, or Failed)
Accessor status (OK, Degraded, or Failed)
Drive Status (OK, Degraded, or Failed).
Drive Status displays Empty, Loading, or Ejected when the drive is empty, loading media, or media is
ejected/unloaded in the drive. It displays Cleaning when the cleaning cartridge is in the drive, and Calibrating while
performing media optimization. See Media optimization.
Magazine status (Closed, Inserted, or Open)
Library Settings
I/O station (Enabled or Disabled)
Auto cleaning (Enabled or Disabled)
Library mode (Random or Sequential).
In Sequential mode, Loop and Auto load mode are also displayed.
Bar code label length
2 Ethernet Displays the following information:
Ethernet Information
TCP/IP Settings
IPv4/IPv6 Settings
SMTP Settings
SNMP Settings
 Loading...