3 – 61
3.3
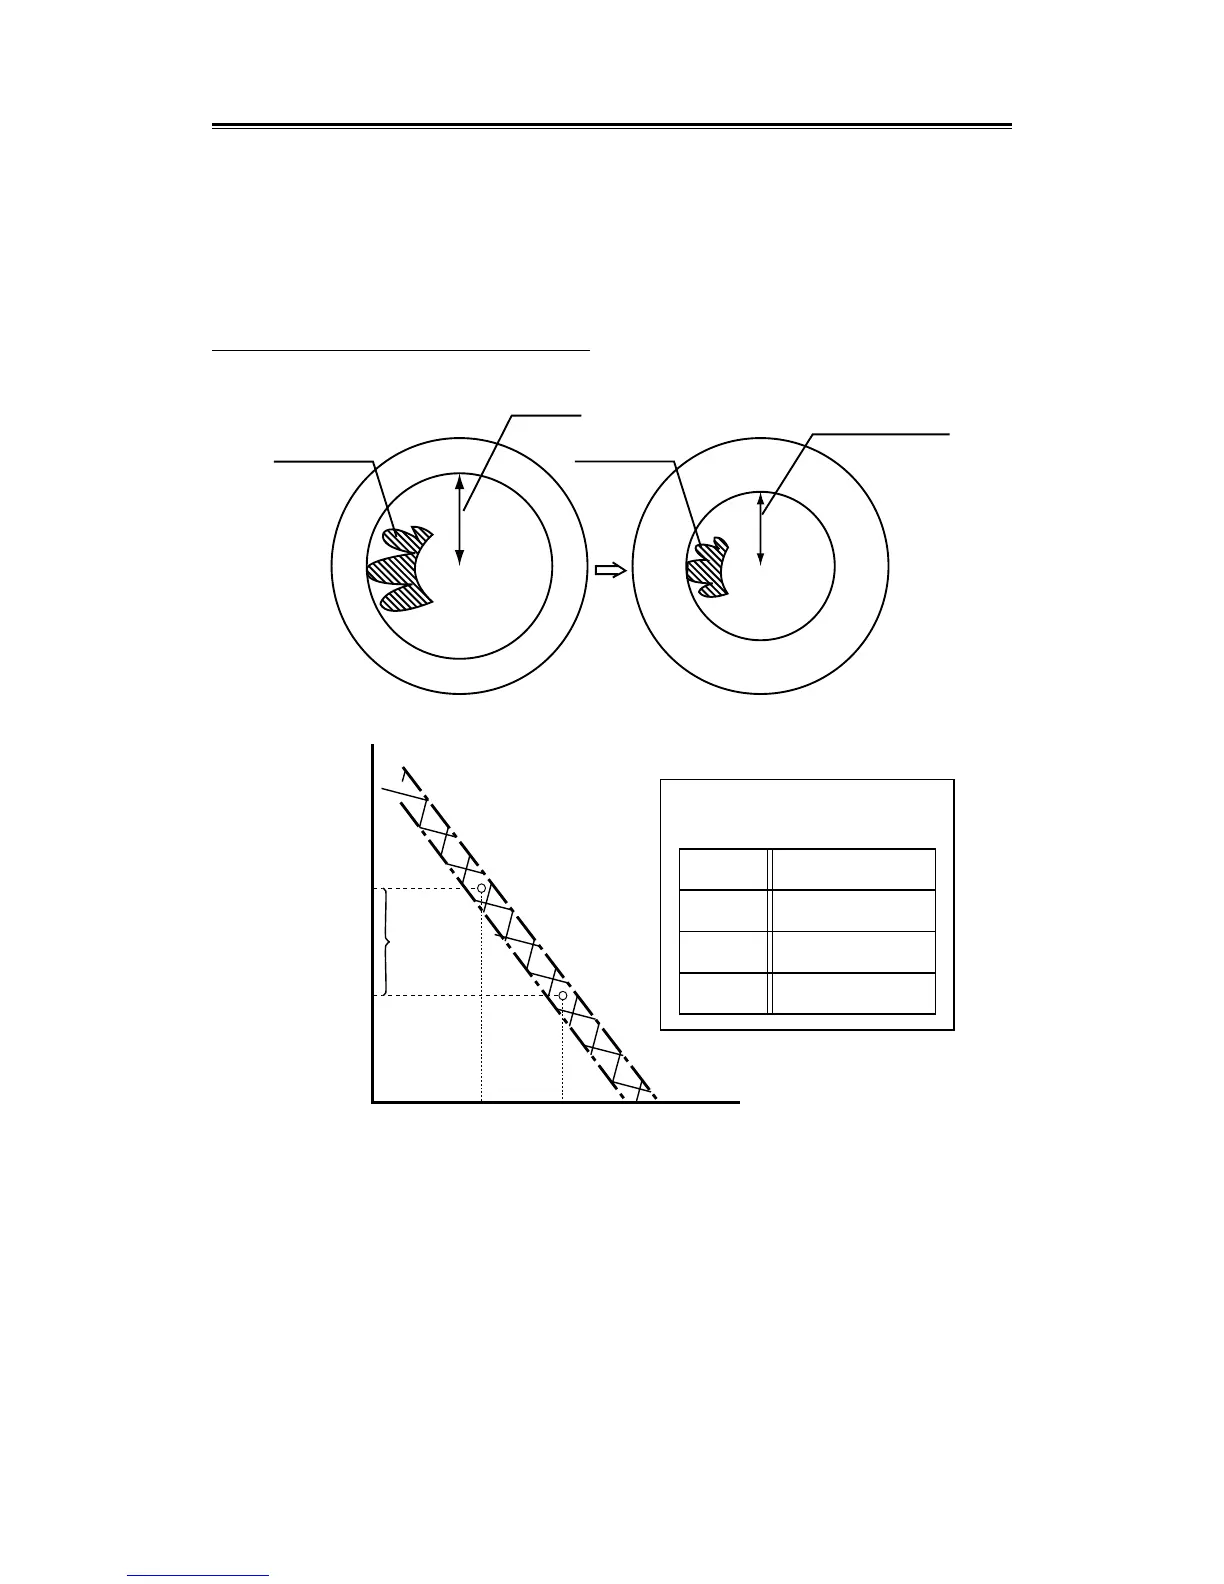
Example : If it is assumed that the maximum range of the initial PM pattern, rBmax, recorded in the
Information Label is 16 NM and the maximum range of the current PM pattern, rAmax, is 14
NM, the value of decrease, △r(max) = 5 dB, can be obtained from calibration curve II, which
shows that the sensitivity of the receiving system has lowered by approx. 5 dB.
Example of checking the receiving system
16NM
P.M.FORM
ABOUT 14NM
P.M.FORM
Calibration Curve II
Maximum range of PM pattern, r max
16
14
12
10
8
6
4
2
0
dB
DECLINE OF SENSITIVITY
12
R(14)
R(16)
0 13141516
rAmax rBmax
17 18(NM)
∆r
PERF. MONITOR
INFORMATION LABEL
DATE P. MON
'95 1/20 8.0
 Loading...