KICstart Version 1.1.0.x
KICstart User Manual 35
Live Profile Graph Display
The live profile graph display is displayed only when using the KICstart with trailing wires or elongated
thermocouples. The live profile graph display will show the profile plot on the graph for the current profile
that is running. You will only see the Live Profile Graph Display when the KICstart profiler remains
connected while profiling.
While the KICstart is in the oven, and until the profile has ended, the software will continue to display the
live profile graph. The other tab at the top of the screen; Description is inaccessible.
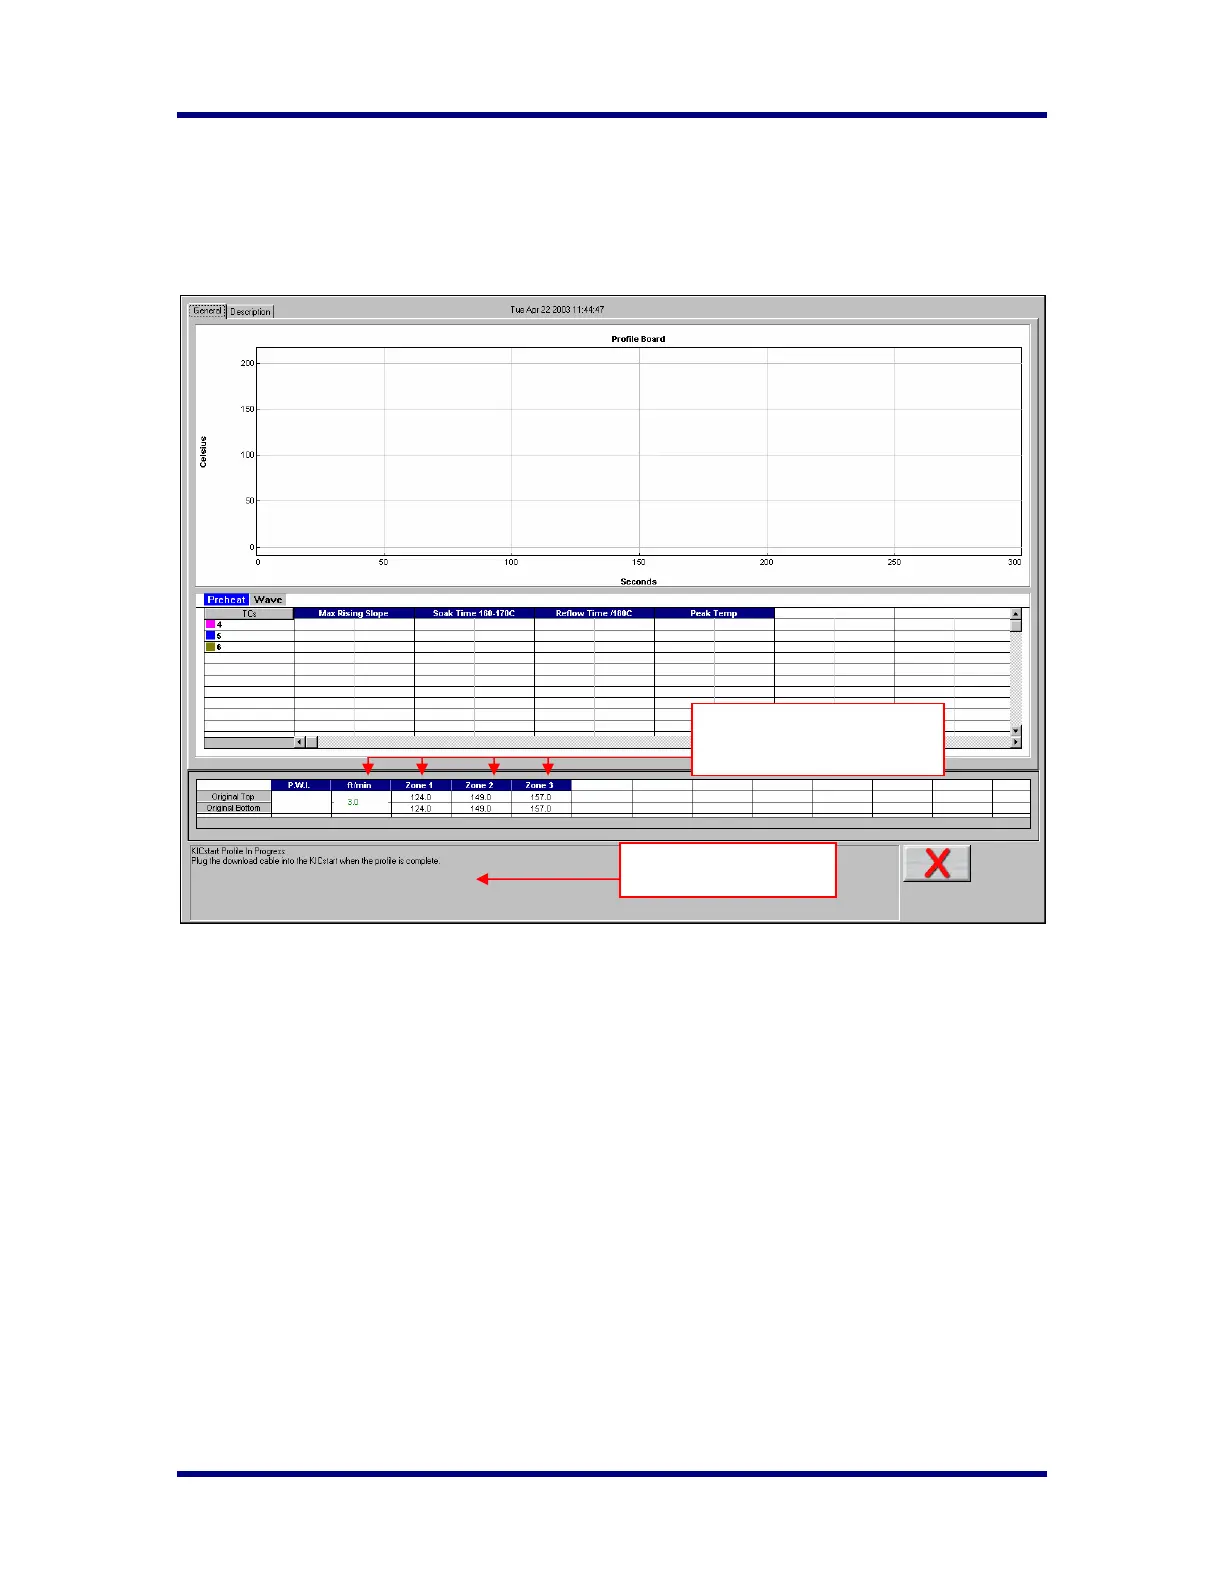
• The current oven temperature setpoints and conveyor speed for this profile is displayed beneath
the Statistics table.
• The profile status is displayed at the bottom of the screen.
The Live profile graph display will remain on your screen until the KICstart has achieved the trigger
temperature that determines the profile end, and the KICstart communication cable is connected.
Oven temperature settings
and conveyor speed.
Profile status