KICstart Version 1.1.0.x
KICstart User Manual 37
Profile Graph Display
Once the KICstart software
opens the Profile Graph
Display, the tabs at the top
will be accessible. The
General Tab will show the
profile results for preheat and
wave sections of the profile.
You can select either the
Preheat tab or the Wave tab
above the Statistic table.
Preheat tab
The Preheat tab represents
only the section of the profile
before the wave. The
KICstart software draws a
Blue rectangle around the
area that represents the
preheat area. The profile
Statistics and setpoints which
are shown below the profile
graph depict only the preheat
section of the profile, the
profile data inside the Blue rectangle.
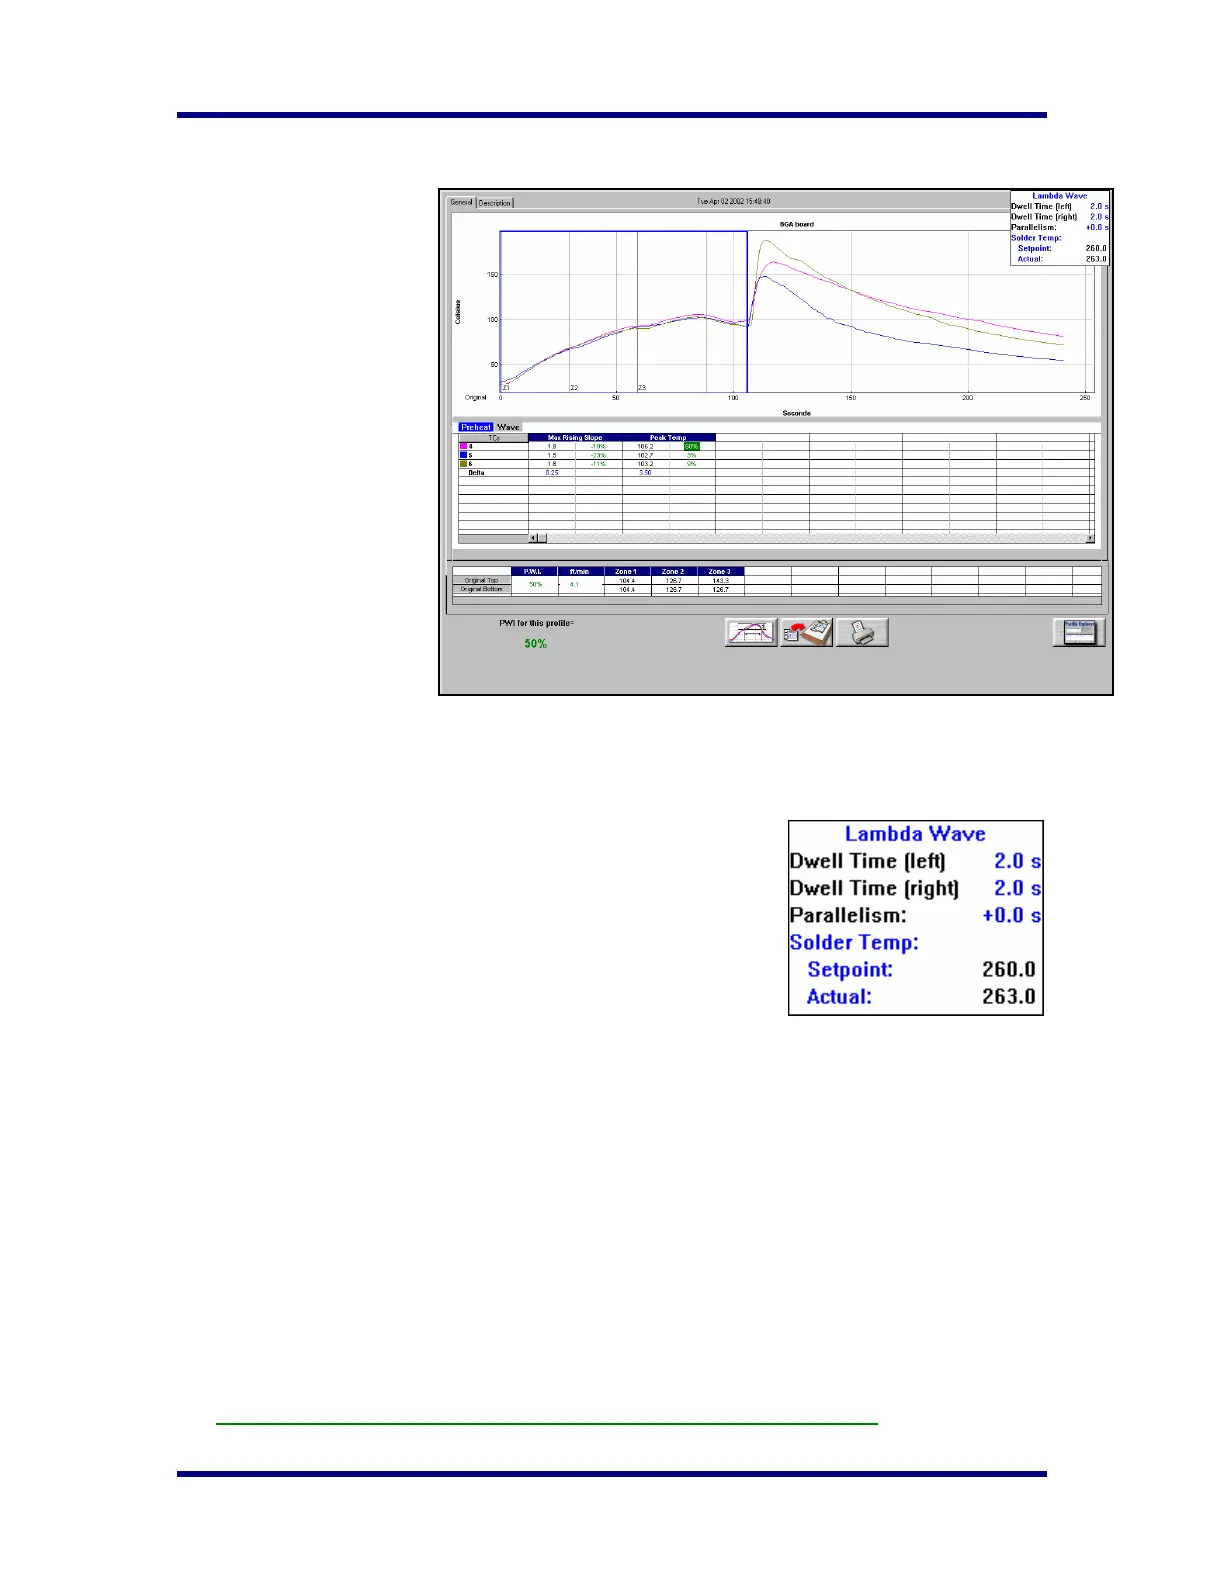
Information regarding the Wave TCs is displayed in a window at the upper-Right hand corner of the profile
graph. This information includes; Dwell time, parallelism, and the solder temperatures for the wave(s).
Wave Tab
The Wave Tab will show profile information specific to the wave portion
of the profile. The KICstart software draws a Blue rectangle around the
area that represents the Wave area. The profile Statistics and setpoints
which are shown below the profile graph depict only the Wave section of
the profile.
Profile Information from the Wave TCs is displayed in a window at the
upper-Right hand corner of the profile graph. This information includes;
Dwell time and Parallelism in seconds, and the solder temperature
setpoint and actual for the wave(s) portion of the profile.
The Dwell time is measured by the Wave TCs. The Parallelism is the measured time difference between
when the Wave TC-Left, and Wave TC-Right hit the wave.
The Solder Temperature setpoint is input by the user before the profile when entering oven setpoint
information. The solder temperature value is measured by the Air TC during the profile.
Statistics - Below the profile graph is the Profile Statistics. The Statistics are a numeric representation of
the profile and how well the profile fits the selected Process Window. The Statistics for this profile and the
predicted profile are shown. A percentage value is displayed in each cell beside the Statistic value. This
percentage represents the amount of Process Window being used. A PWI under 100% indicate the profile
fits within the selected Process Window, a PWI 100%or higher indicates the profile has exceeded the
selected Process Window. The KICstart software will only display PWI values for the Preheat Statistics.
Original Setpoints - Below the profile Statistics is the oven temperature and conveyor settings. The
original setpoints represent the oven settings when this profile was run.
The F9 function key will print any active profile screen of the KICstart software.