09/2021 ECO Gold 95 / 134
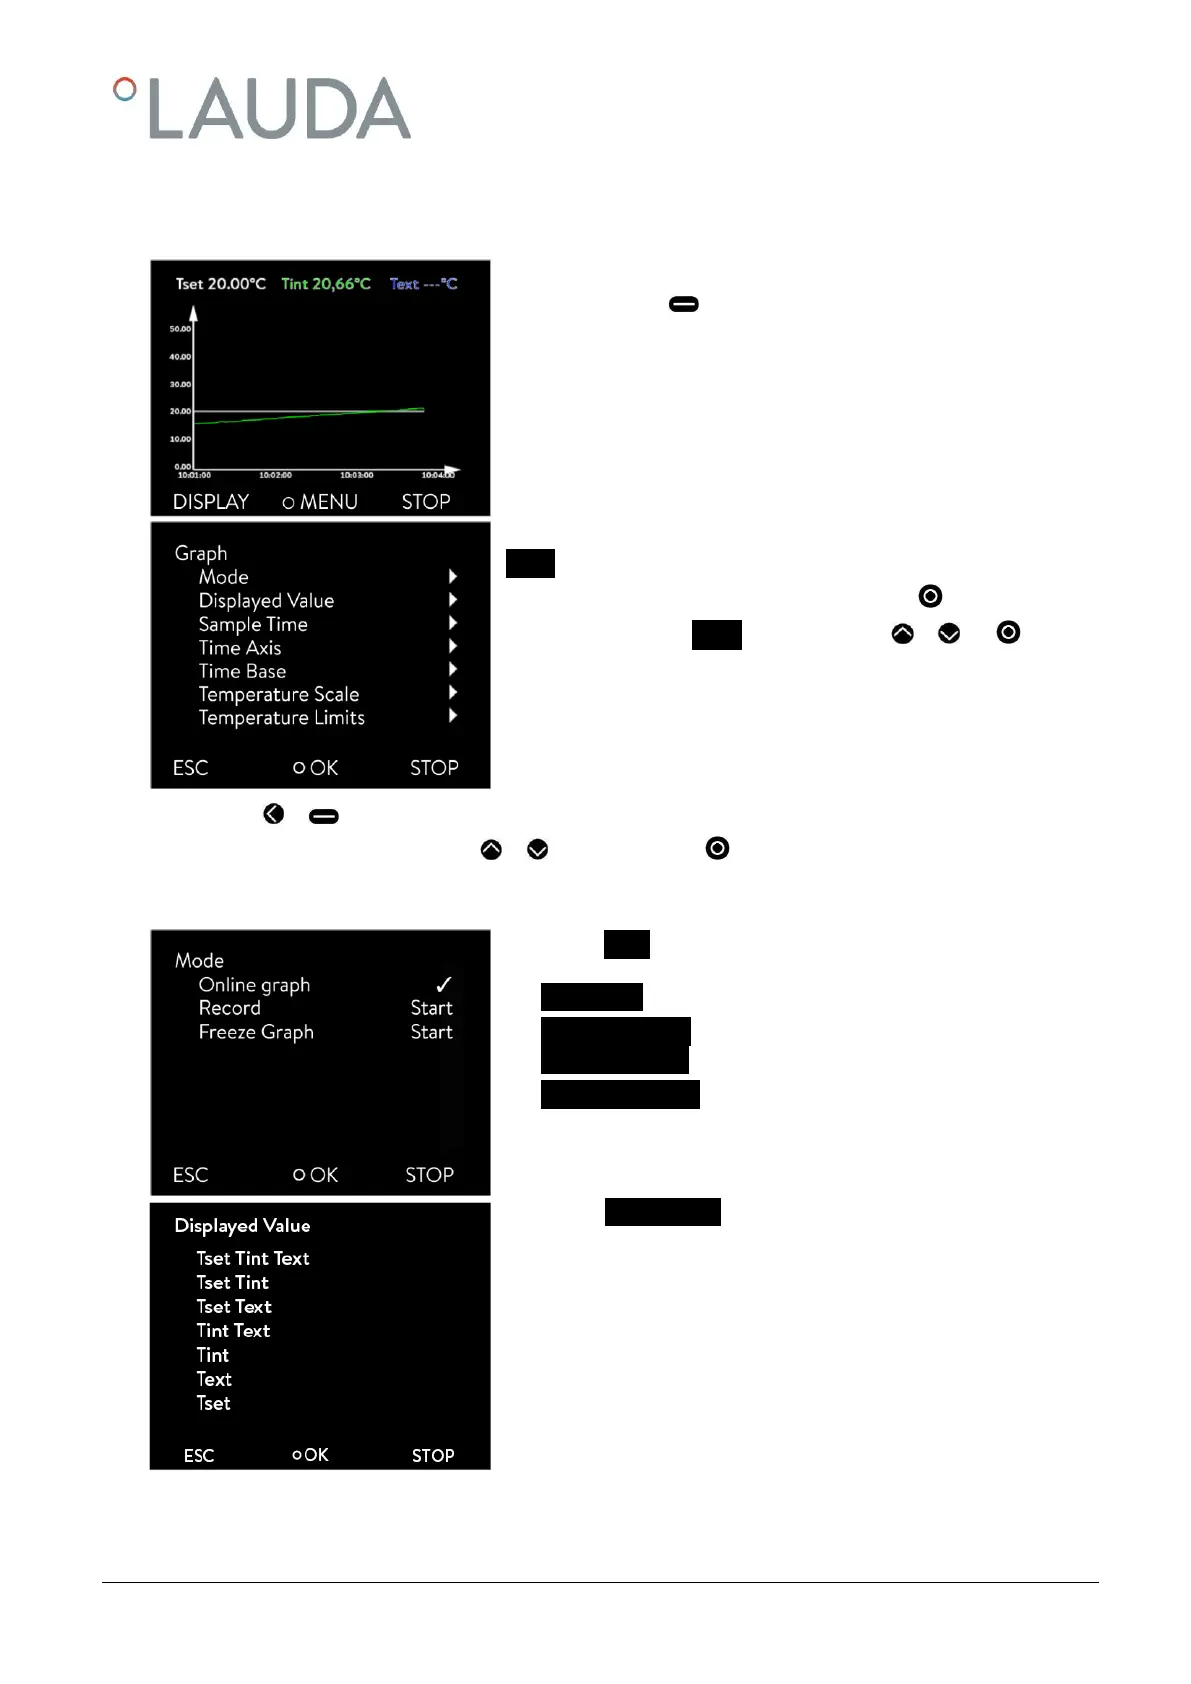
15 Graphical display of temperature measurements
- From the main menu window you access the graphics window
by pressing (DISPLAY).
The temperature traces are shown in different colors.
- T
set
set-point temperature (grey)
- T
int
internal bath temperature (green).
- T
ext
external bath temperature (blue).
You can change the settings for the graphics window in the submenu
Graph.
- Access to the menu level is obtained by pressing .
- Select and confirm Graph in main menu with or and .
The adjacent menu window appears.
- With or you quit the respective window without changes.
- All menu points are selected with or and confirmed with .
In the following the individual menu points of the menu window "Graph" are described.
In the menu Mode there are the following settings:
- Online graph Recording runs continuously.
- Recording Start Start or stop recording
Recording Stop
- Freeze Graph Start Save current recording.
With display Measurements you can define which temperature values
are to be graphically displayed.
Numerous combinations are offered in the menu (see illustration).