Operation
73
300554859_002_C0 - 11/2016 - © Leybold
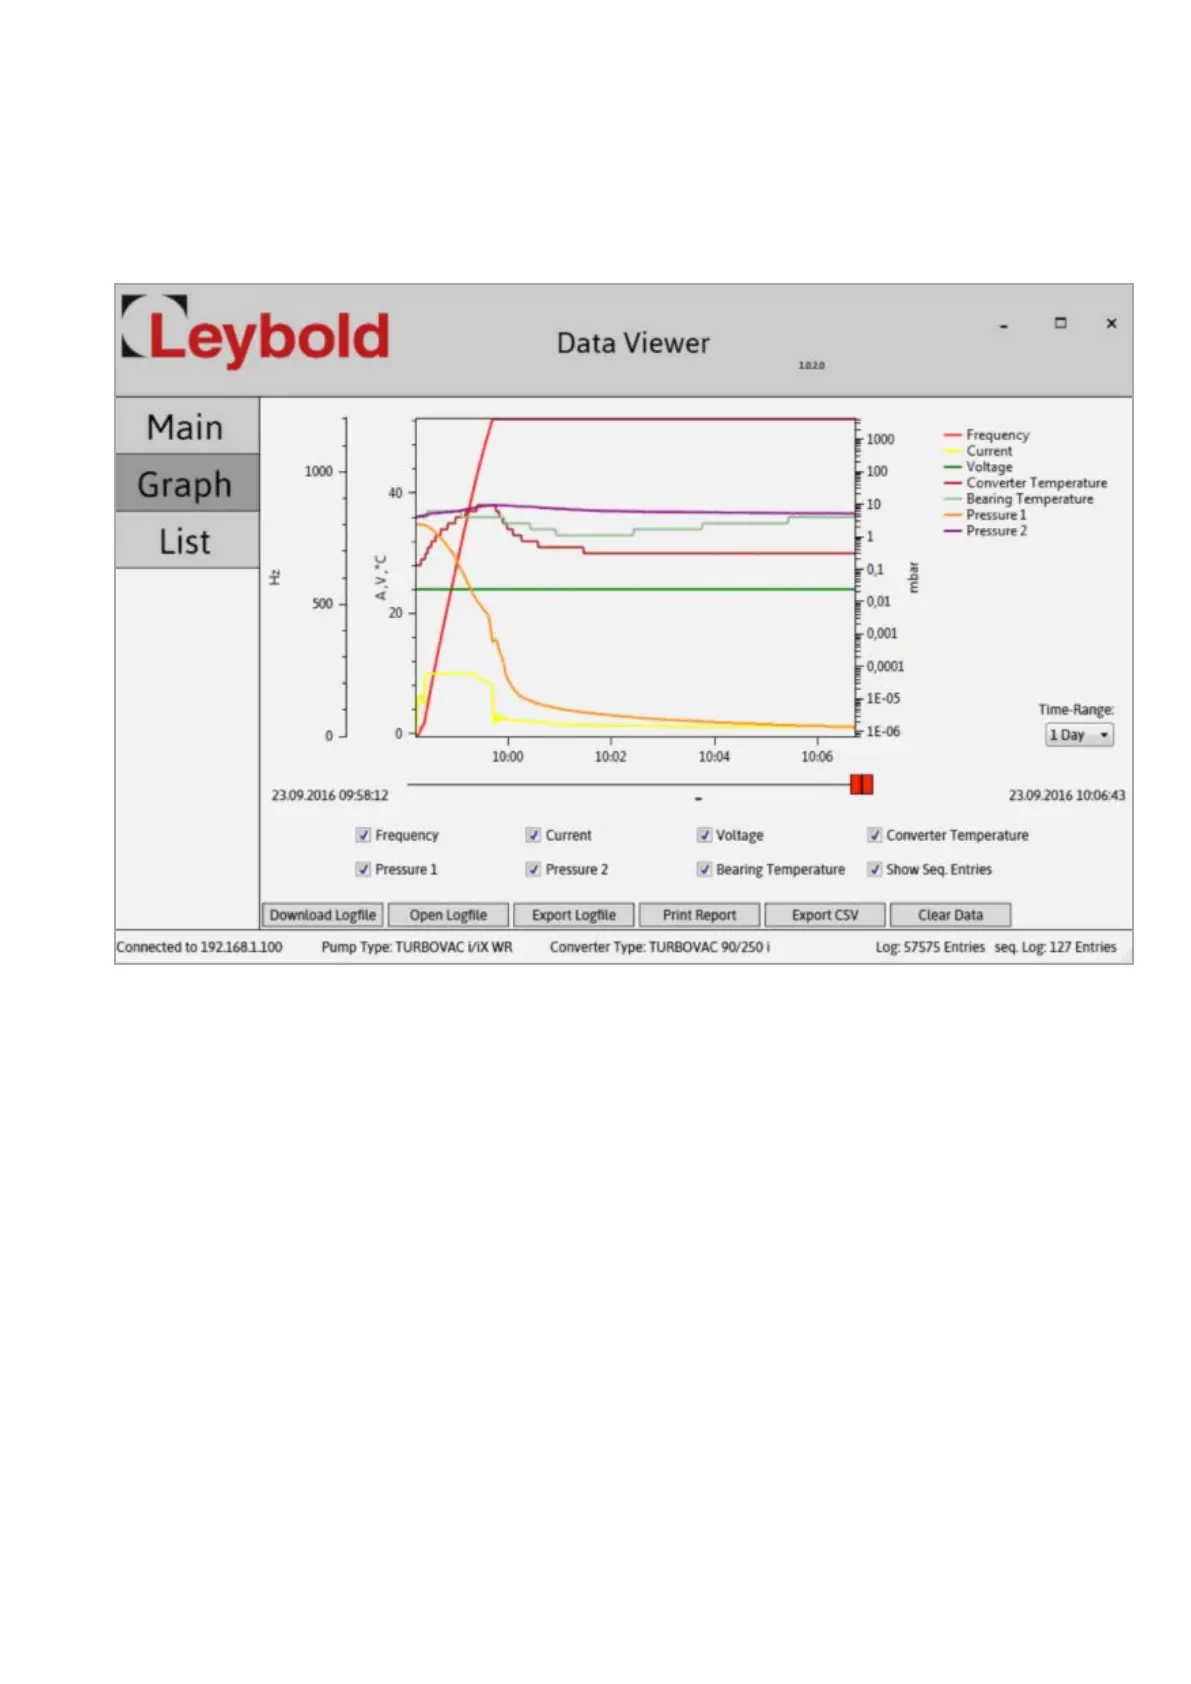
Fig. 4.17 Trend display
The buttons in the lower section of the display allow the following:
■
Loading data from the device. Downloading is indicated through the coun-
ter incrementing at the bottom right-hand corner.
■
Opening a previously exported log file
■
Exporting a downloaded log file into a .log file
■
Exporting a downloaded log file to the Excel CSV file format
Trend Display
Here the measured trend data is displayed in a graph. Through the red slid-
ers, the selection window may be moved to a certain point of time and you
may zoom into the data. Zooming into the data is effected also through the
third mouse key or the key combination ALT + left mouse button. To remove
or show the data, switch the checkmark at the corresponding data off or on.
Artisan Technology Group - Quality Instrumentation ... Guaranteed | (888) 88-SOURCE | www.artisantg.com
 Loading...