The User Interface
128
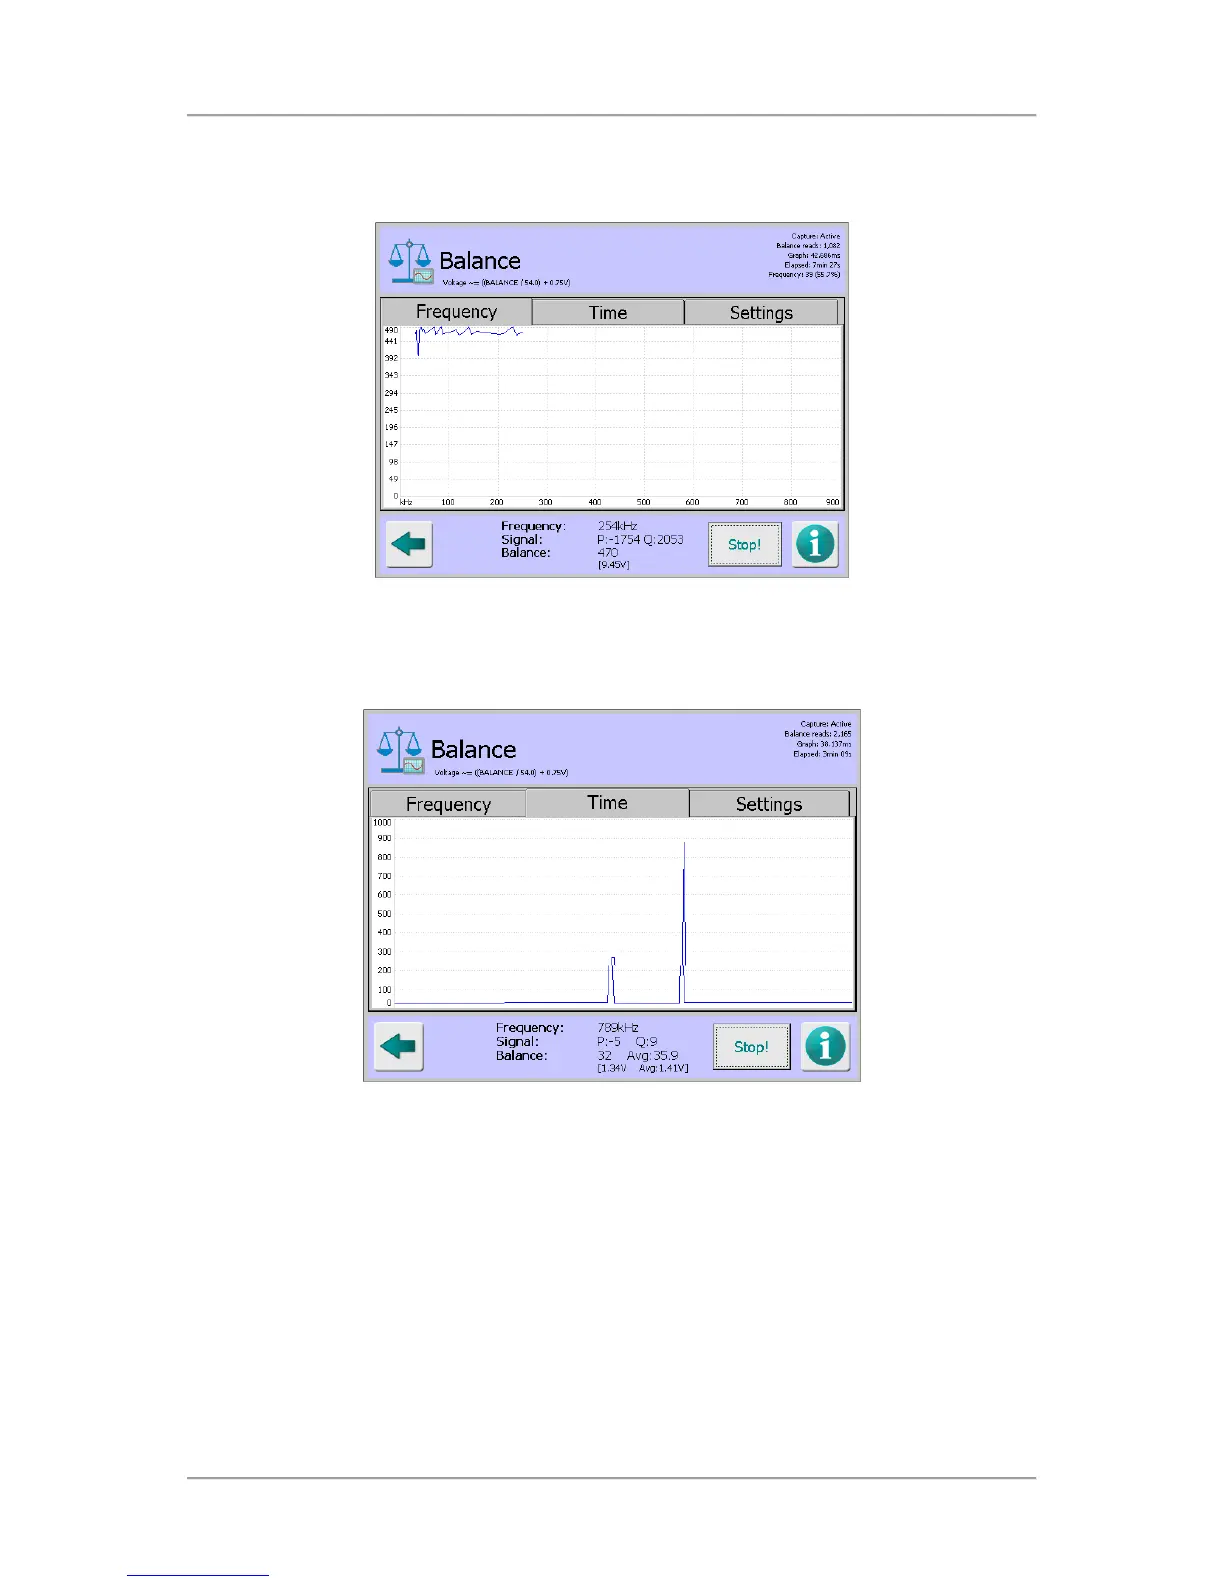
Tapping on the Capture button with the Frequency tab selected starts a process that steps
through each of the 70 available frequencies, captures the balance values at each frequency
and displays them on a graph which updates in real time
Time tab
Tapping on the Capture button with the Time tab selected starts a process that captures the
balance value at the currently set frequency and displays a scrolling graph of that signal over
time.
Tapping anywhere within the graph pops up the Frequency screen which displays a list of the
70 available frequencies. Tapping on a frequency selects it and closes the screen. The
selected frequency is then used and displayed in the plot
 Loading...