84
Full Sonar Chart. The Overlay Data (depth and water temperature)
are set to different text sizes.
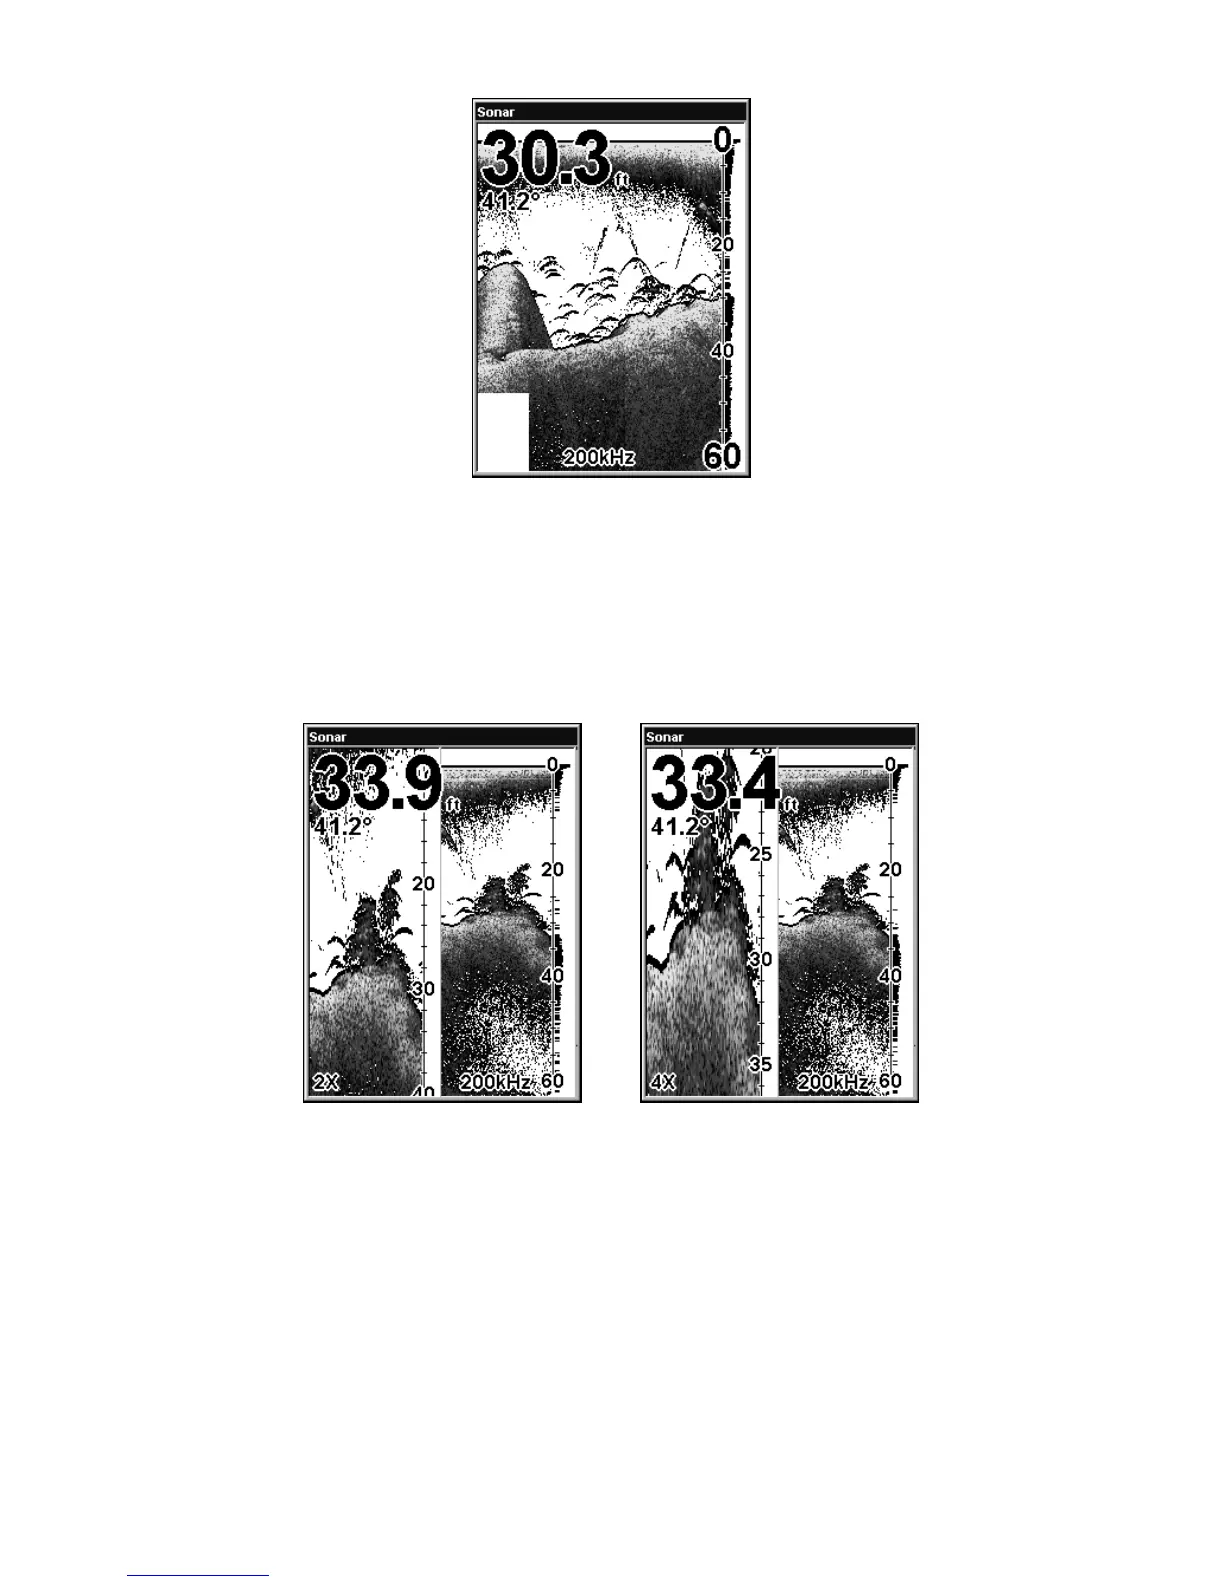
Split Zoom Sonar Chart
A split chart shows the underwater world from the surface to the bot-
tom on the right side of the screen. The left side shows an enlarged ver-
sion of the right side. The zoom range shows at the bottom left corner of
the screen.
Split Zoom Sonar Chart. Image at left shows the left window zoomed to
2X. Press ZIN and the left window zooms to 4X, shown at right.
Digital Data
This mode shows the chart on the right side of the screen. The left side
has five large digital data boxes or windows containing (by default):
Water Depth; Water Temperature; Water Speed (from an optional
speed sensor); Water Distance (distance traveled or log, it also requires
a speed sensor); and Voltage. The Depth box also shows settings for the
Shallow and Deep alarms.