■■■■■■■■■■■■■■■■■■■■■■
6 Carrying out simple titrations
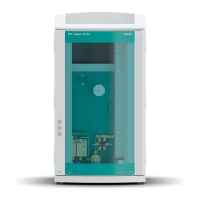
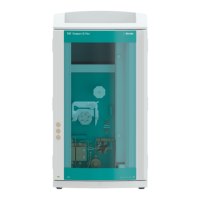
916 Ti-Touch
■■■■■■■■
33
3
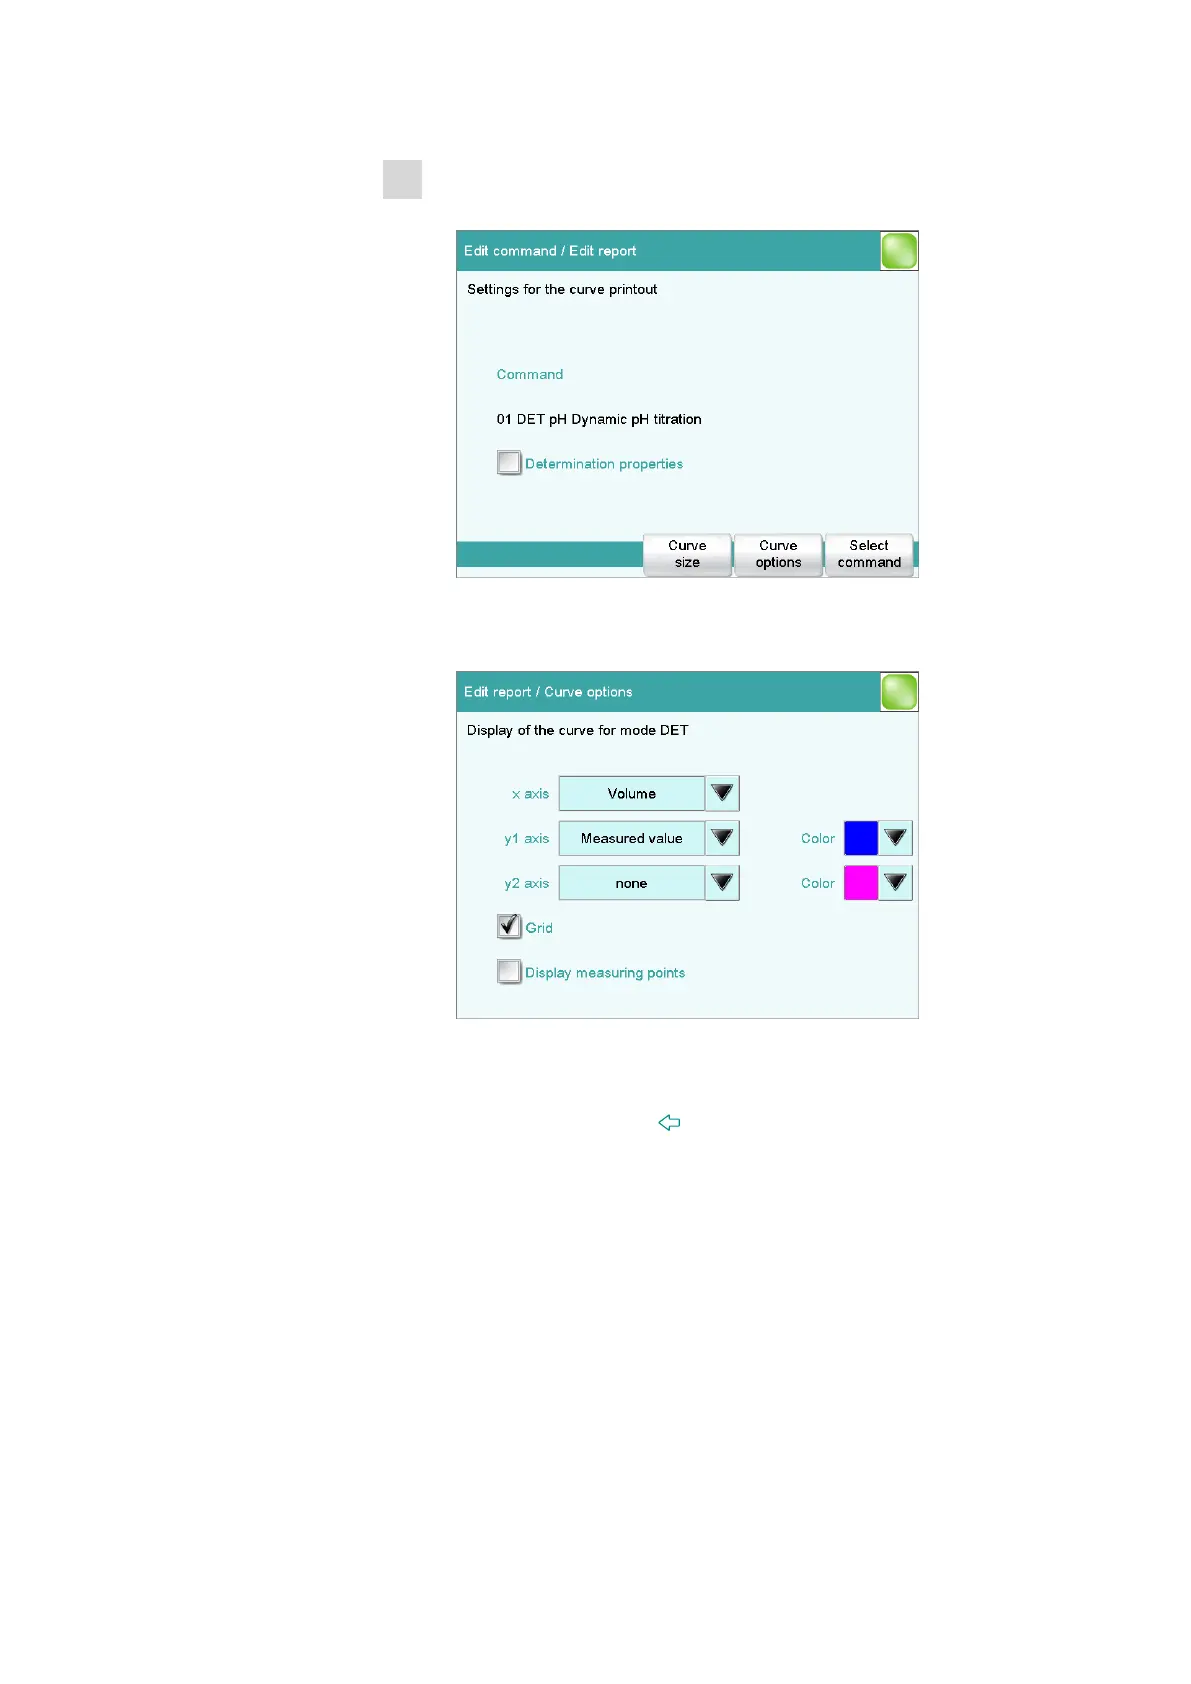
Define the curve display
■ Select Curve and tap on [Edit].
Various settings can be established for the output of the titration
curve.
■ Tap on [Curve options].
Here you can, for example, select the colors for the measurement
curve or add a second type of curve.
Tap on the input field y2 axis and then select ERC. Afterwards,
close the dialog with [
] or [Select].
When the report is printed out, the ERC curve (1st derivative) will
be printed out along with the standard titration curve.
 Loading...