5
Issue 1.0 January 2018
Data Acquisition
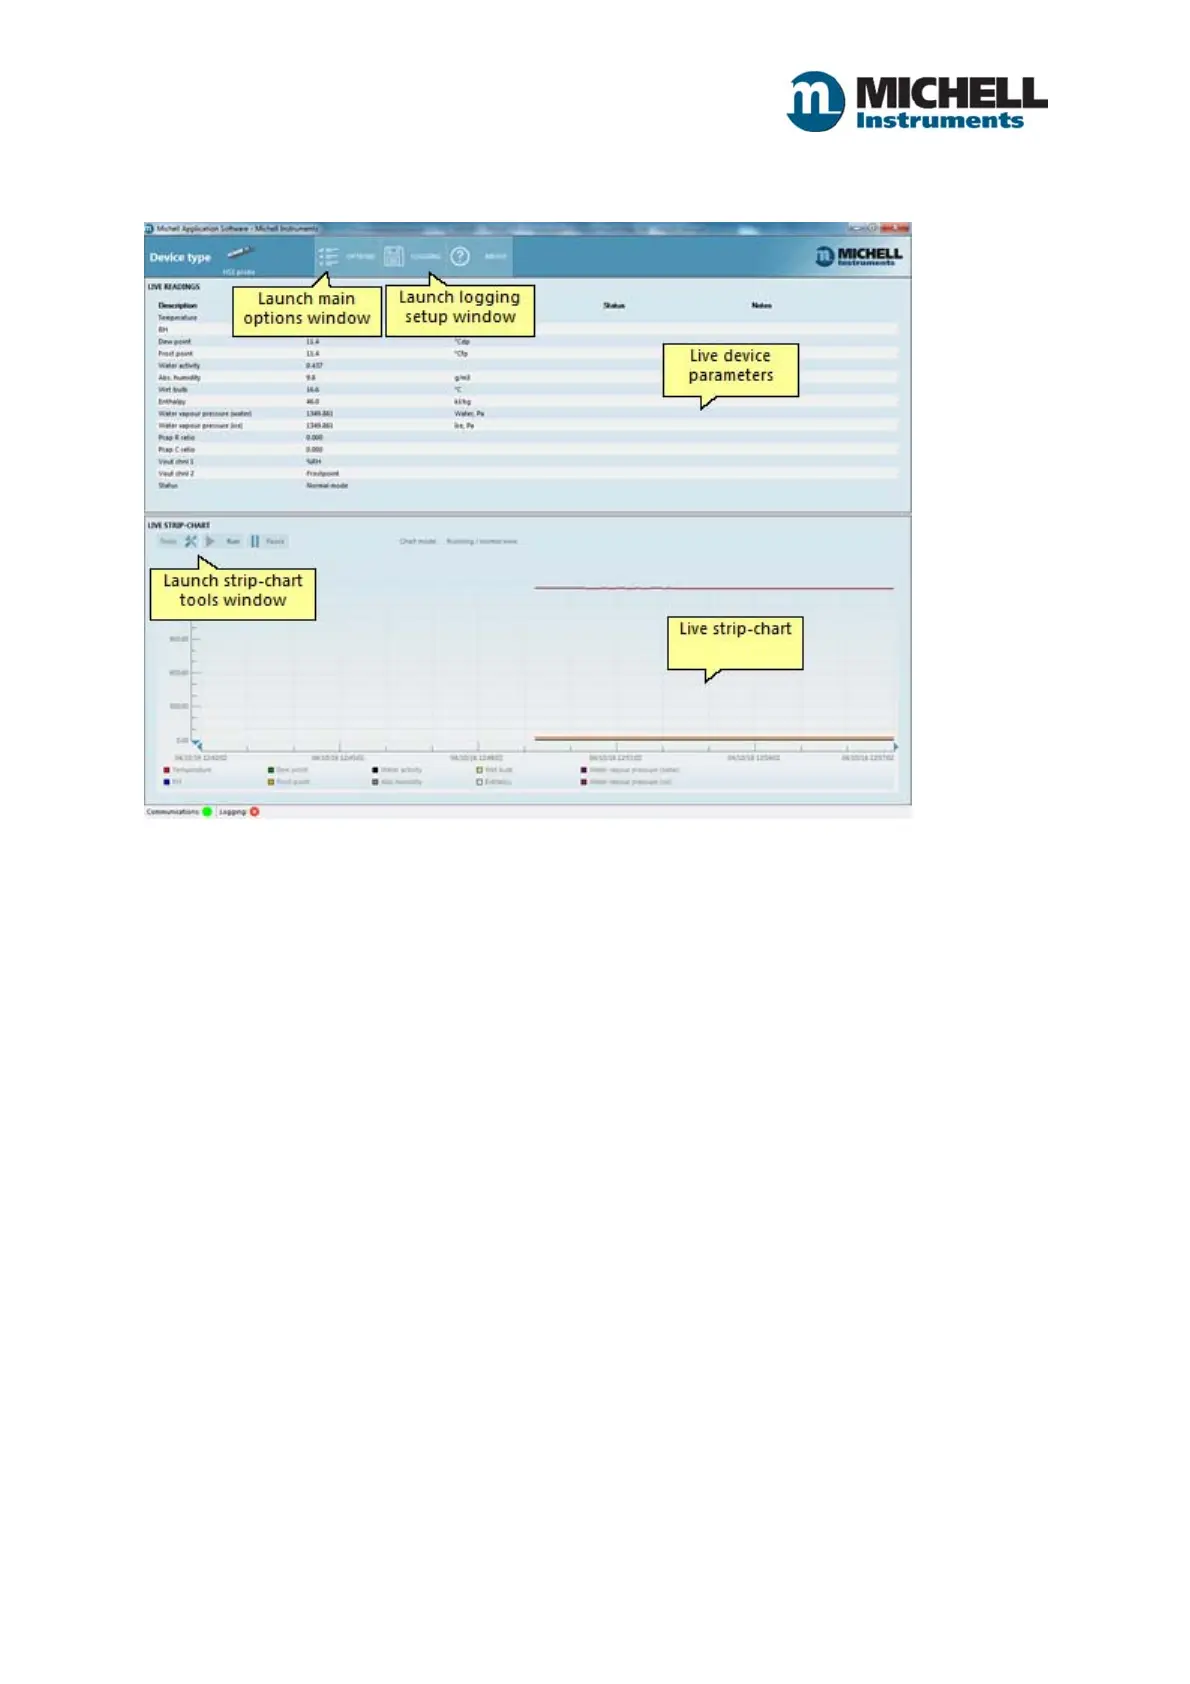
The Data Acquisition window provides display, strip-charting and logging of main device parameters.
Live device parameters
Live parameters are listed in the top half of the window. These include primary measurements (such
as humidity and temperature), status information and any notes.
Any warnings or critical conditions together with associated notes are displayed in the Status and
Notes columns of the display area. Status column text and is coloured ORANGE for WARNING and
RED for CRITICAL.
Strip-chart
The strip-chart is located in the bottom half of the window and device parameter data is plotted on
the graph from right to left.
The Y-axis automatically scales itself to cover all data, the date/time X-axis span is initially set to 2
minutes and the strip-chart update interval is 2 seconds.
NOTE: Each chart series is allocated a (circular) buffer size of 86,400 (eighty-six thousand, four
hundred). With an update interval of 2 seconds, 48 hours of data can be stored, after which old data
is removed to add new data.
Zooming
To zoom in on the strip-chart data, left-mouse click and drag a zoom box over the chart area of
interest.