11-14 System Diagnosis and Support
Click [Quit], the system will exit the test interface, and then enter into the
self-test result interface.
Note: In the region of test, the testing items are divided into parent items according to boards and
there are several sub items for each parent item. The testing items can be customized according to
requirements. If the check box before an item is selected ( ), this item is in the testing list;
contrariwise, if the check box before the item is deselected ( ), this item is not in the testing list.
When a parent item is selected, all the sub items of this item are selected by default; contrariwise,
when deselecting a parent item, all the sub items of this item are deselected by default.
Note:
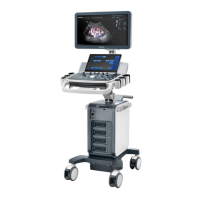
The main interface of self-diagnosis system includes three types: manufacturing, maintenance
and user interface. The self-diagnosis interface of manufacturing is similar with the self-diagnosis
interface of maintenance, which can be divided into 5 regions.
Self-test
items and
test results
area
Test
information
display and
control area
Status
bar
System structure
Monitor
information
Fig 11-2 Maintenance self-test screen
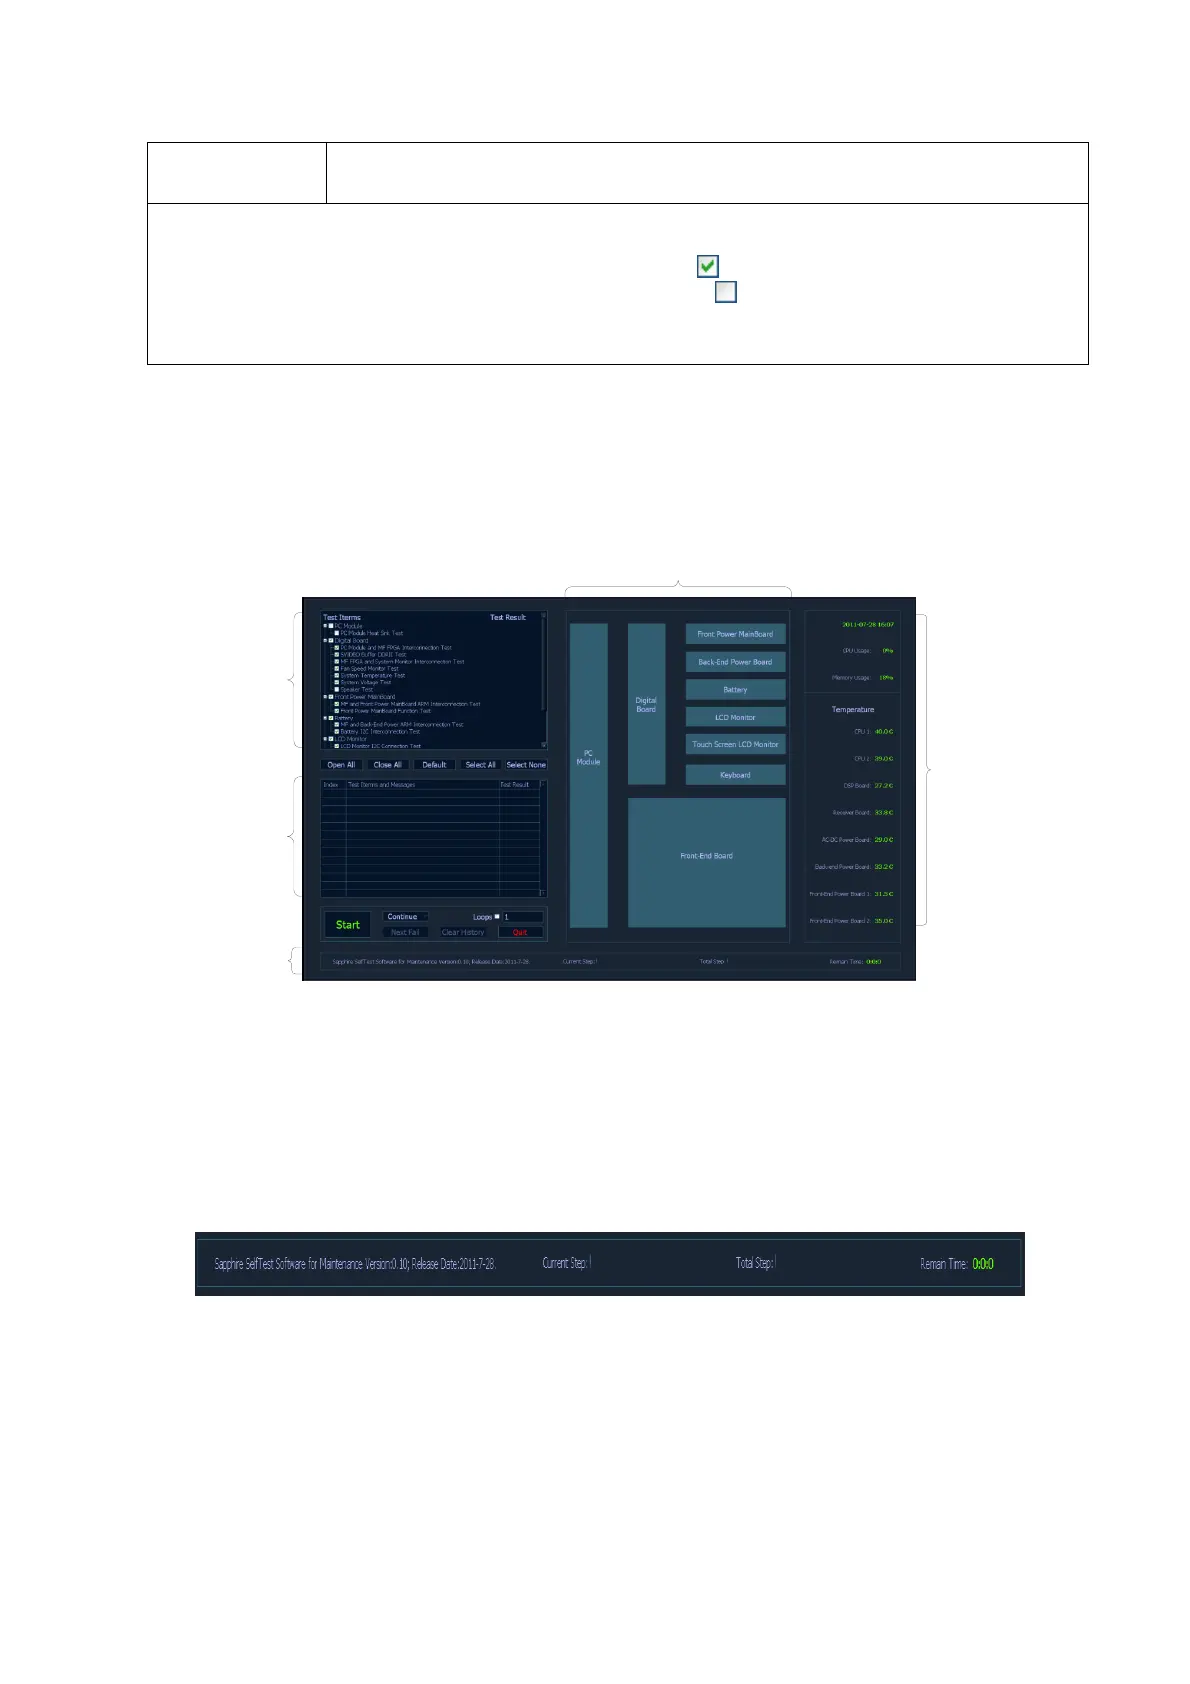
5. Display of the Self-diagnosis Status
When the program is running, the version and issued date will be displayed on the left side of the
status bar: Sapphire Self-test Software for Manufacture Version:xx; Release Date:YYYY-MM-DD.
During the test, the software version in the status bar will turn to the name of the item on test. And
the test progress of current item and the total test progress are also displayed in the status bar.
Besides, the remaining test time will also be displayed.
Fig 11-3 Sketch Map of Status Bar
6. Monitor information bar
Monitor information bar displays the current time, CPU occupancy ratio, memory occupancy ratio,
temperatures of CPU1, CPU2, CPU3, CPU4, DSP board, receiving board, AC-DC power board,
back-end power board, front-end power board.

 Loading...