8 - 31
8. DEBUGGING FUNCTION
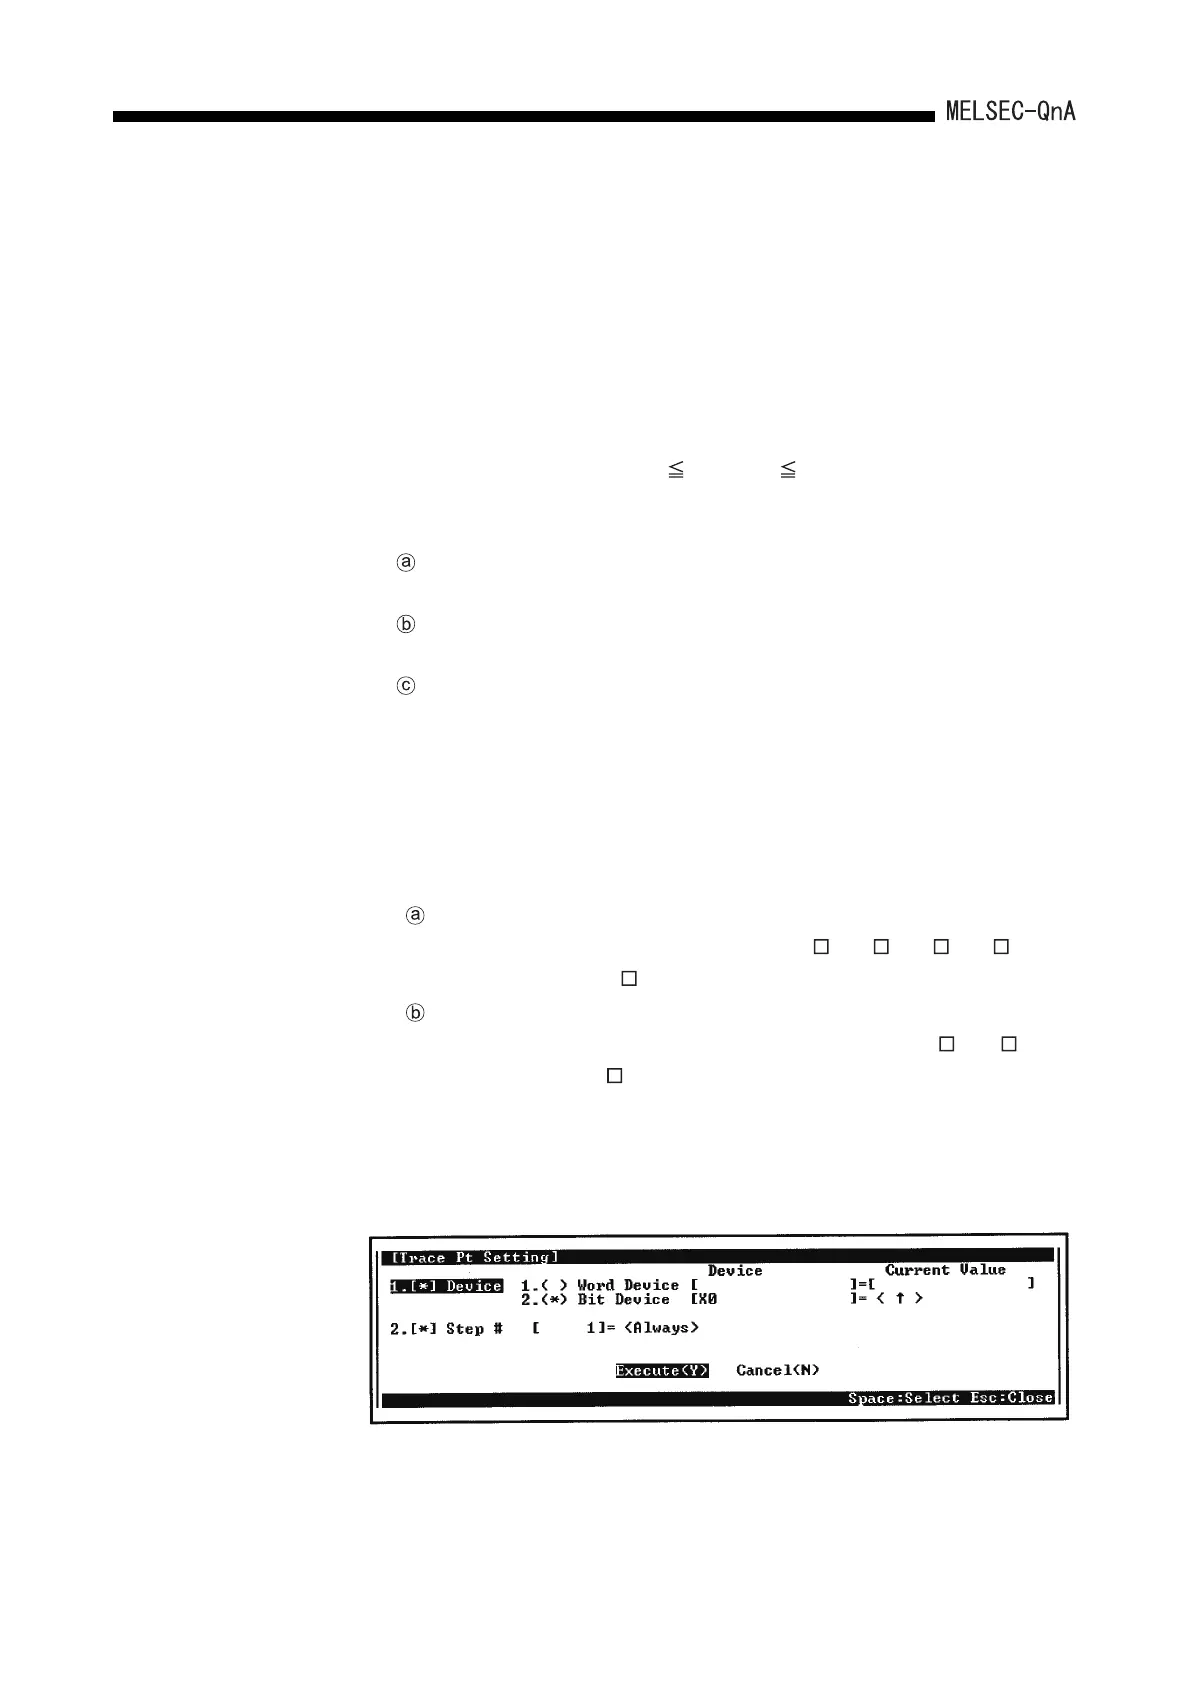
The following shows an explanation of the screen above:
One of the following four settings can be made for the trace condition: "1. Trace
Counts", "2. Trace Point", "3. Trigger Point", or "4. Added Trace Information".
1) "Trace Counts"
In the case of the total count, set the number of sampling traces executed
from start to end of the trace.
In the case of the count after the trigger, set the number of sampling traces
executed from the trigger execution to the trace end.
The following shows the formula that sets range for these counts:
2) "Trace Point"
Set the timing for collection of trace data. Select one of the following:
The following shows the setting device under the detailed condition.
The following qualifications are possible with respect to the devices listed
above.
• Digit designation for bit devices
• Bit number designation for word devices
Every END : Data collected at END instruction of every
scan.
Every Interval : Data collected with each designated time.
Setting range is 5 to 5000ms in 5ms units.
Specify Detail Condition
: Set a device and step number.
The following shows setting examples: The
details on how to make the settings and data
collection timing are the same as described in
Section 8.2.1 Monitor condition setup in
Monitor Function.
Bit device : X, FX, Y, FY, M, L, F, SM, V, B, SB, T (Contact), ST
(Contact), C (Contact), J \X, J \Y, J \B, J \SB,
BL \S
Word device : T (Current value), ST (Current value), C (Current
value), D, SD, FD, W, SW, R, Z, ZR, U \G, J \W,
J\SW
Count after trigger total count 8192
 Loading...