8 - 33
8. DEBUGGING FUNCTION
(3) Execute the sampling trace.
Execute the sampling trace by using "1. ( ) Execute Trace & Display Status" on
"Sampling Trace" screen.
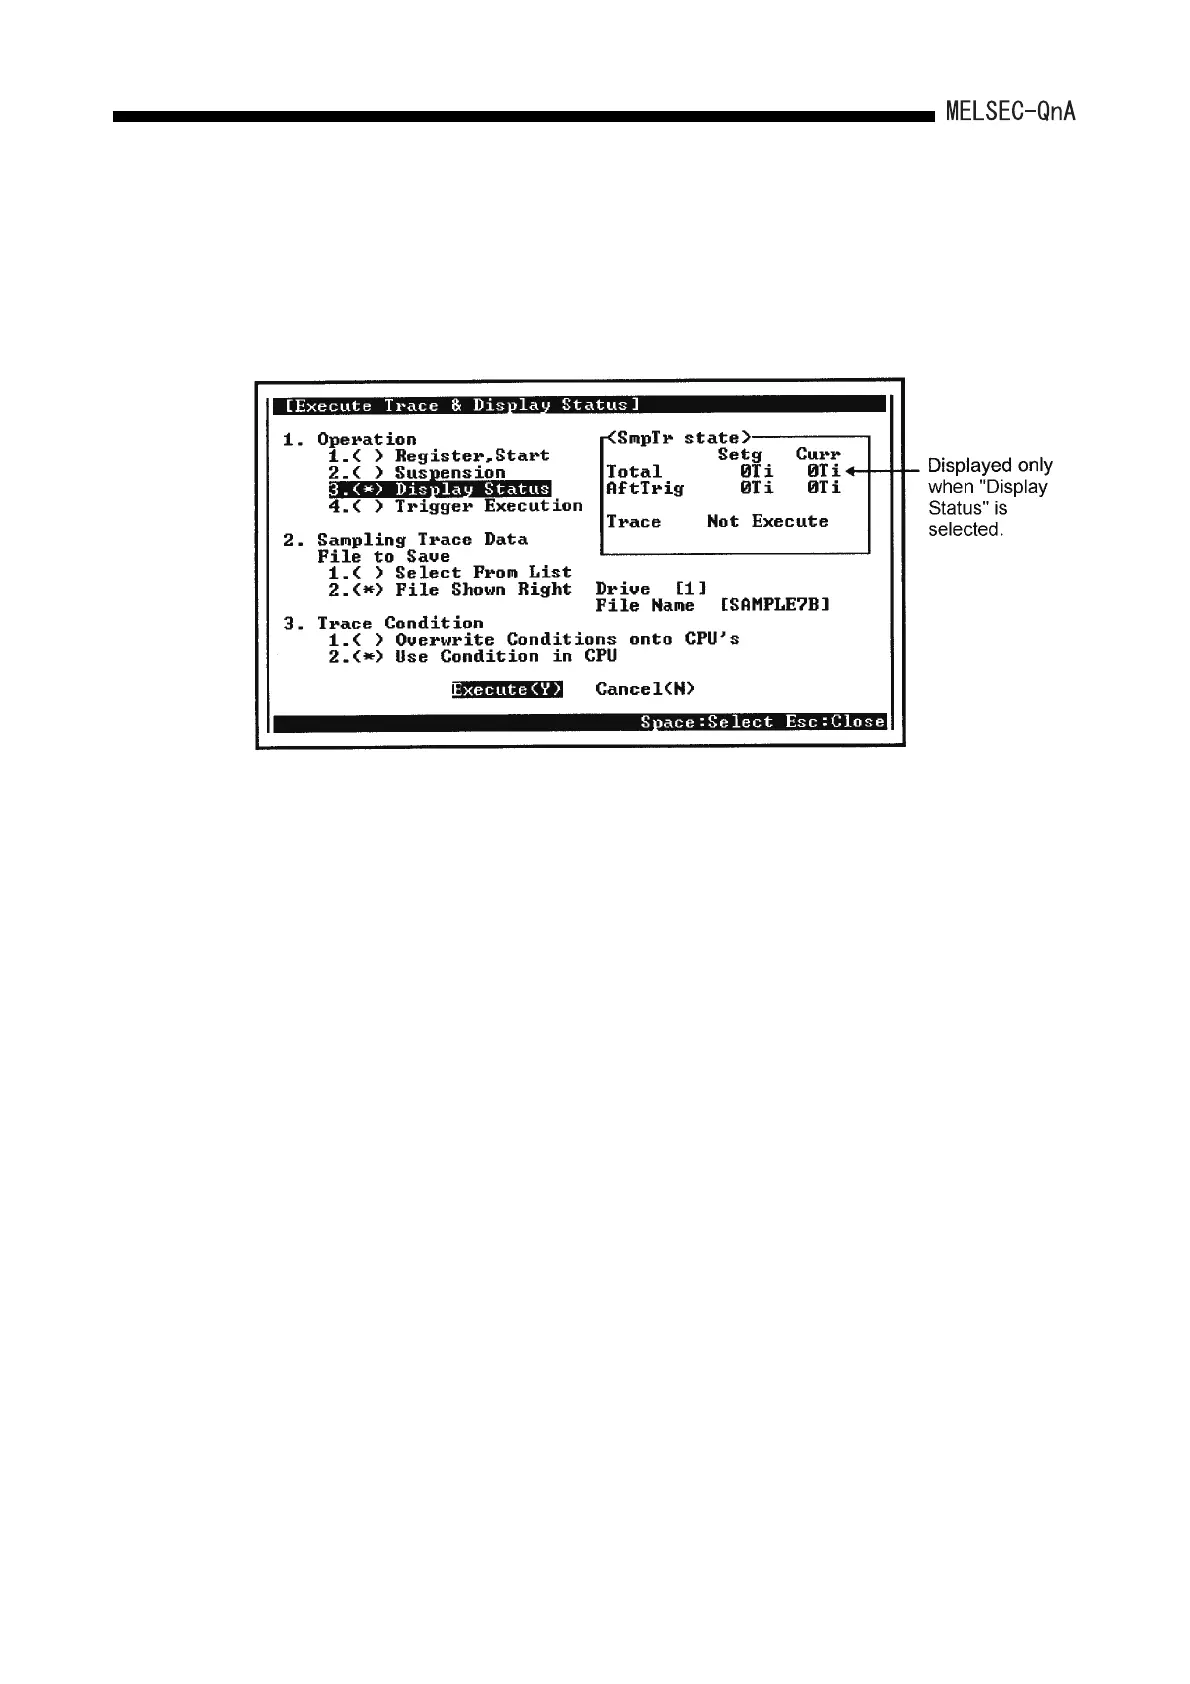
The following shows a setting example for "1. ( ) Execute Trace & Display Status".
The following shows an explanation of the screen above:
The following settings can be made for "Execute Trace & Display Status" : "1.
Operation", "2. Sampling Trace Data", and "3. Trace Condition".
(a) "Operation"
Select one of the following:
(b) "Sampling Trace Data"
Select one of the following:
1) Register, Start : The trace is registered and started. The trace count is
started.
2) Suspension : The trace is suspended. The trace count and the
count are cleared after the trigger. (To restart the
trace, select "Register, Start" again.)
3) Display Status : The trace statuses are displayed on the same
screen.
4) Trigger Execution : The count is started after the trigger.
The trace is ended on reaching the designated count
after the trigger.
1) Select From List : Data from among the sampling trace files in the
memory card are selected.
2) File Shown Right : The drive number and sampling trace file name are set.
 Loading...