Operating Instructions
View a first derivative of a trace
The CT100 can perform a wide range of mathematical transforms of on-screen traces, both in
static and real-time forms. The following example demonstrates the use of the first derivative
plot.
1) Press the SCAN button. The Scan and Trace menu appears.
2) Press the SELECT button until the trace of interest is selected.
3) Select the Math option from the Scan and Trace menu. The Math menu will appear.
4) Select 1
st
Derivative from the menu.
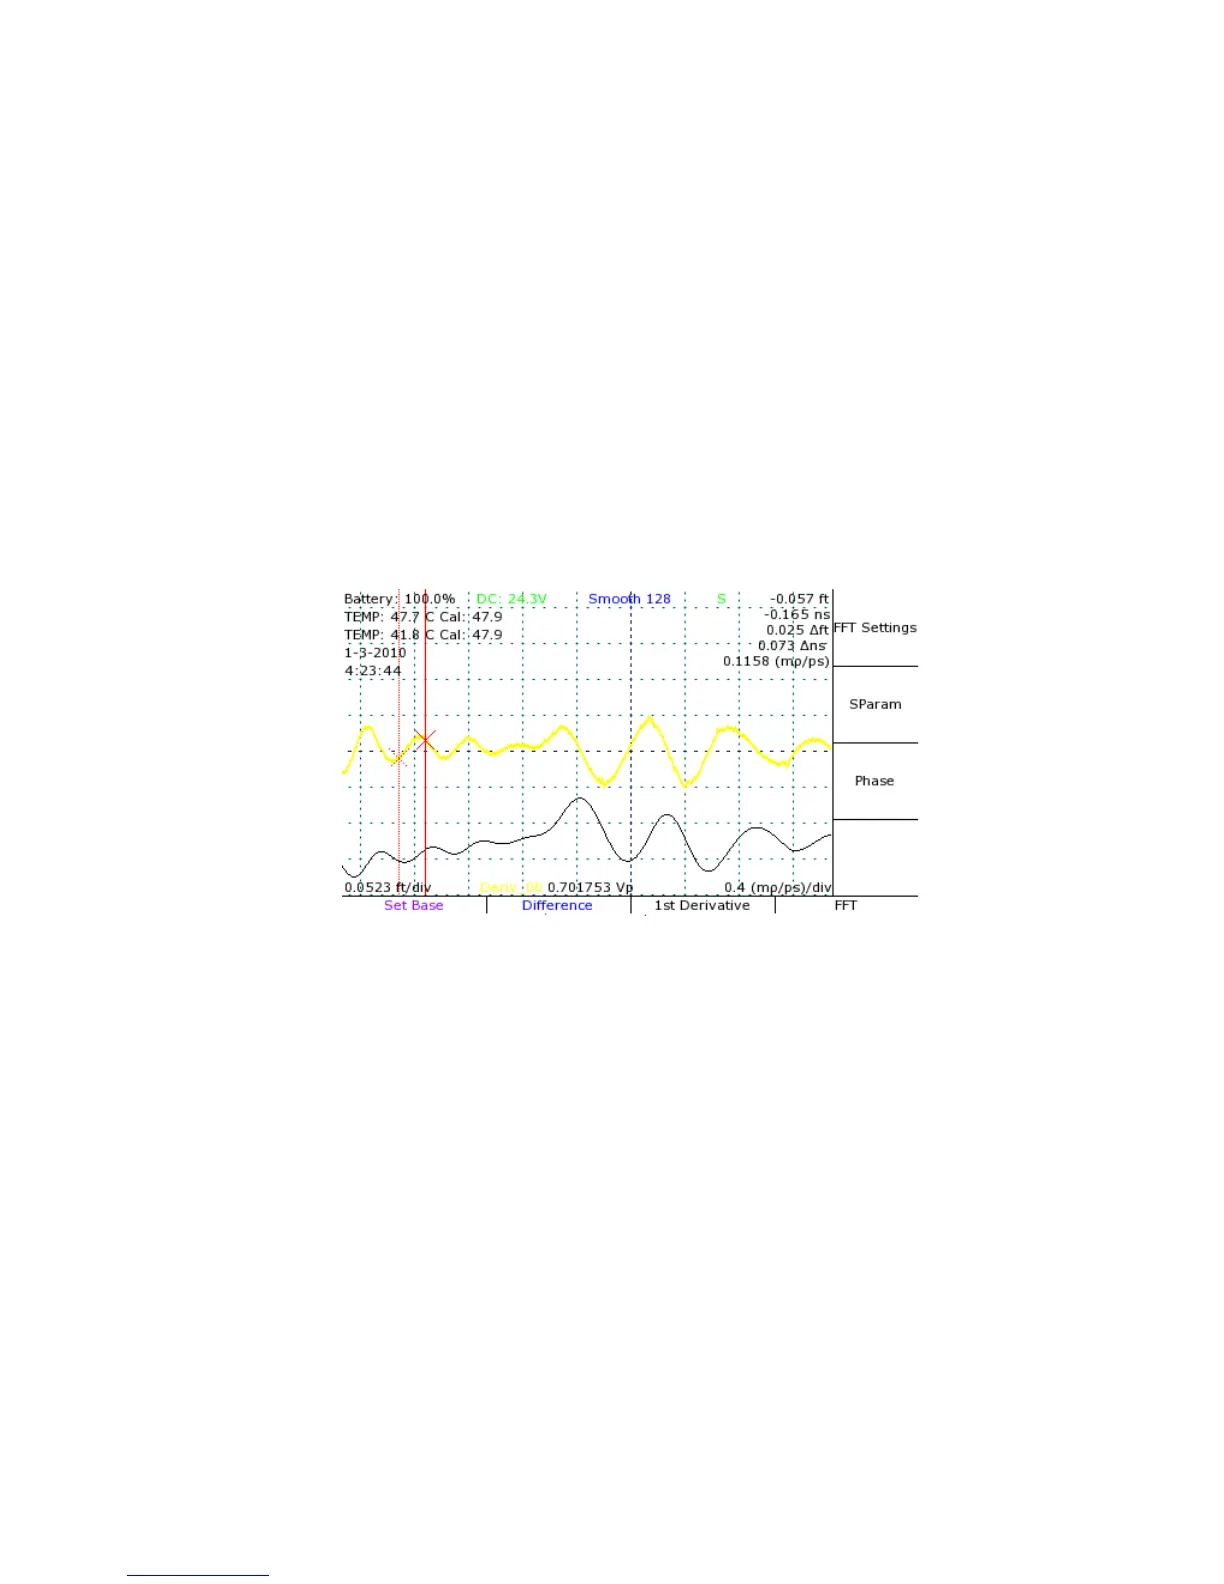
5) A new trace is created that displays the first derivative of the base trace. See Figure 17.
View a Fast Fourier Transform of a trace
1) Select the live trace with the SELECT button.
2) Use the CURSOR button and the HORIZONTAL POSITION knob to set the boundaries for
the FFT with a cursor at either end.
3) Press the SCAN button to open the Scan menu.
4) Select the Math menu option to open the Math menu.
5) Select the FFT menu option. The CT100 will now take a high resolution scan of the live
trace between the cursors, then convert the scan into an FFT plot. This may take some
time.
Mohr CT100 / CT100HF Operator's Manual 47
Figure 17: First-derivative plot (top) of an on-screen trace (bottom).
A wide range of mathematical transforms can be easily
implemented.