6 Operation
US SENTRY io 35
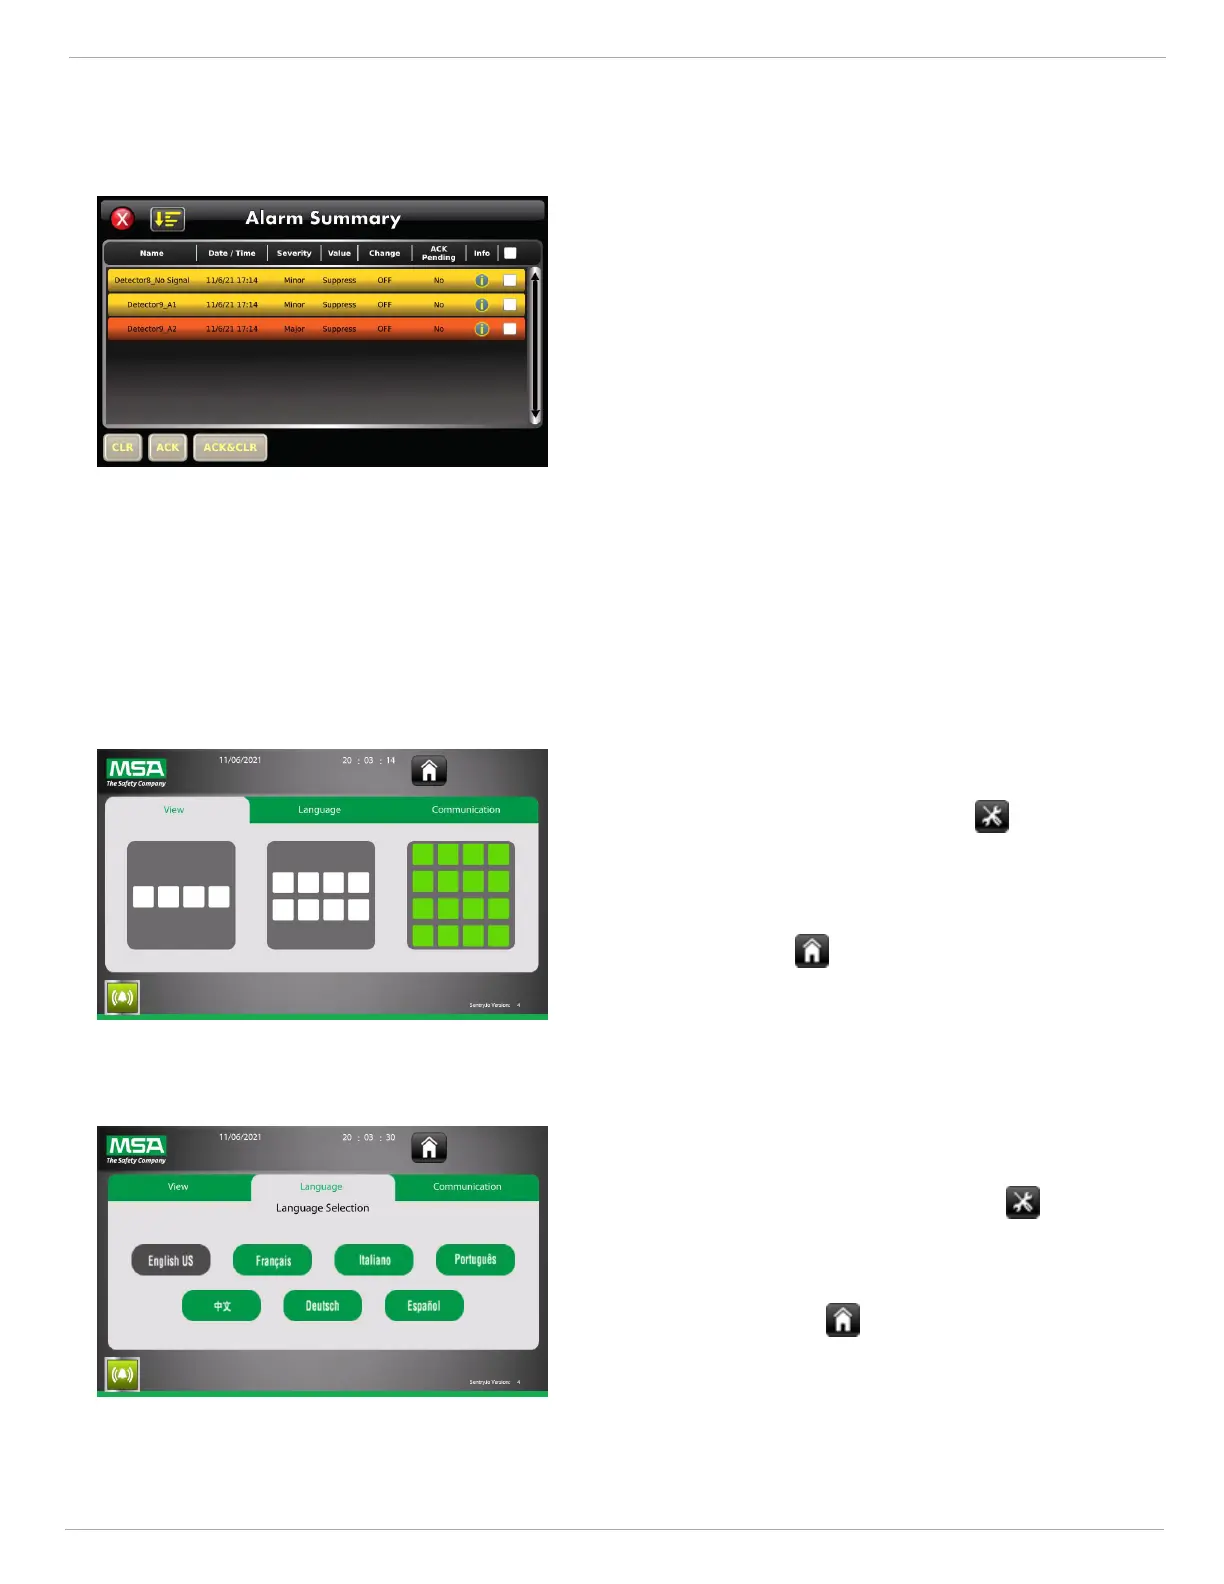
6.1.4 Viewing the Alarm Summary
1. Tap the Bell icon in the bottom left corner of the dashboard
to open the Alarm Summary.
2. The Alarm Summary shows a list of all alarms registered by
the SENTRY io in reverse chronological order. The list is
color-coded based on severity:
○ Red = Critical
○ Orange = Major
○ Yellow = Minor
3. Alarms can be acknowledged and cleared through the Alarm
Summary screen. Use the checkbox on the right to select the
alarm to which you want to apply the action.
4. Tap CLR to clear, ACK to acknowledge, or ACK & CLR to
do both. You can select multiple alarms to perform bulk
actions.
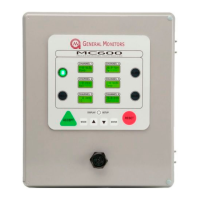
6.2 Tools
The SENTRY io Tools screen contains configuration options for the dashboard view, system language, and
communication type.
6.2.1 Updating the Dashboard View
1.
From the dashboard, tap the Tools icon .
2. In the View tab, tap on the desired dashboard view. This will
determine the size of the detector tiles and how many display
on the dashboard at one time.
3.
Tap the Home icon to return to the dashboard.
6.2.2 Changing the System Language
1.
From the dashboard, tap the Tools icon .
2. In the Language tab, tap on the language.
3. Tap Apply.
4.
Tap the Home icon to return to the dashboard.