16
About the MyStar Extra® Blood Glucose Monitoring System
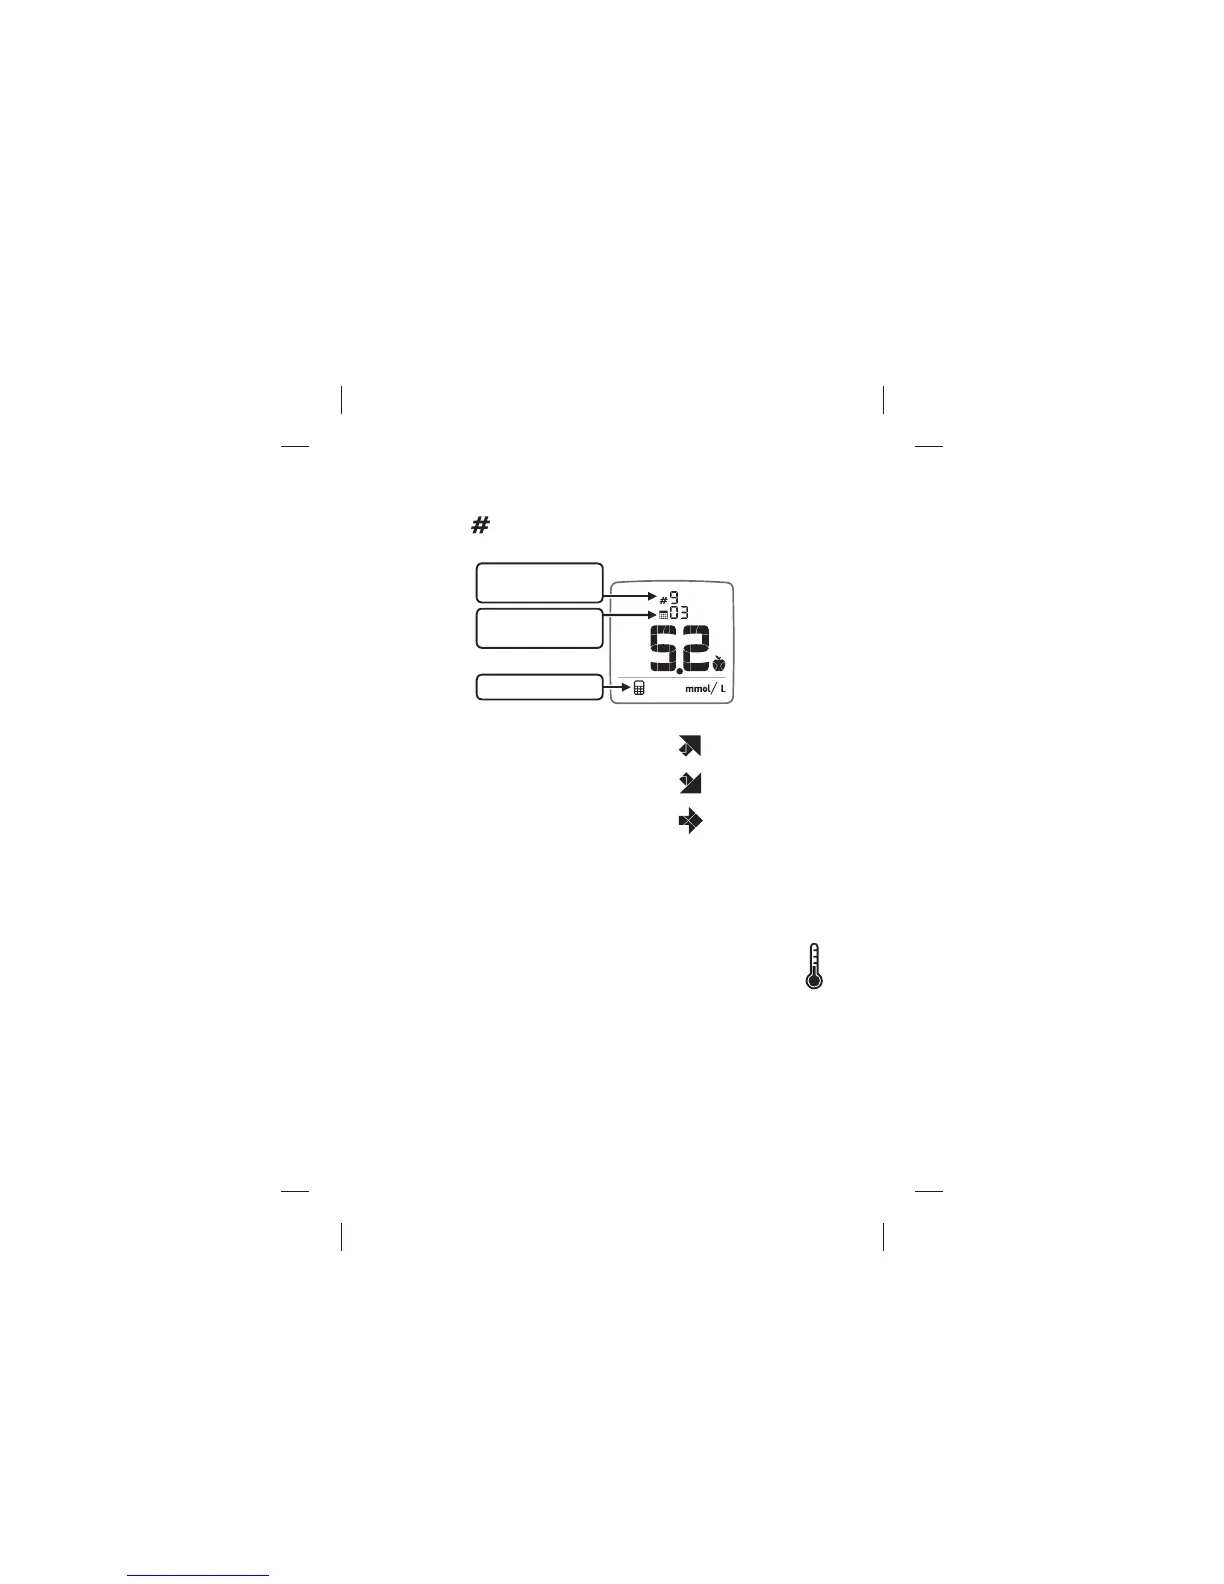
(12) Number of Readings used in Calculations: The number of
readings used in the average calculation is indicated next to the
number icon (
).
(13) Trending Arrows: Trending arrows
may be seen in the Logbook as well as
the ~A1c results screen. The trend arrows
in the logbook illustrates the direction
of your average fasting glucose reading
from the past 3 days as compared to the
median fasting value over the 7 days
before. The trend arrows in the ~A1c results screen indicate the trend
of your A1c result compared to two weeks ago.
(14) Temperature Icon: Appears when the meter is outside
its operating temperature range of 10°C to 40°C.
Number of readings
used in calculation
Number of days
used in calculation
Averages Mode Icon
1. Trending up
2. Trending down
3. Steady