OCM Pro CF
page 76 OCM Pro CF - Rev. 09 as of 07.06.2016
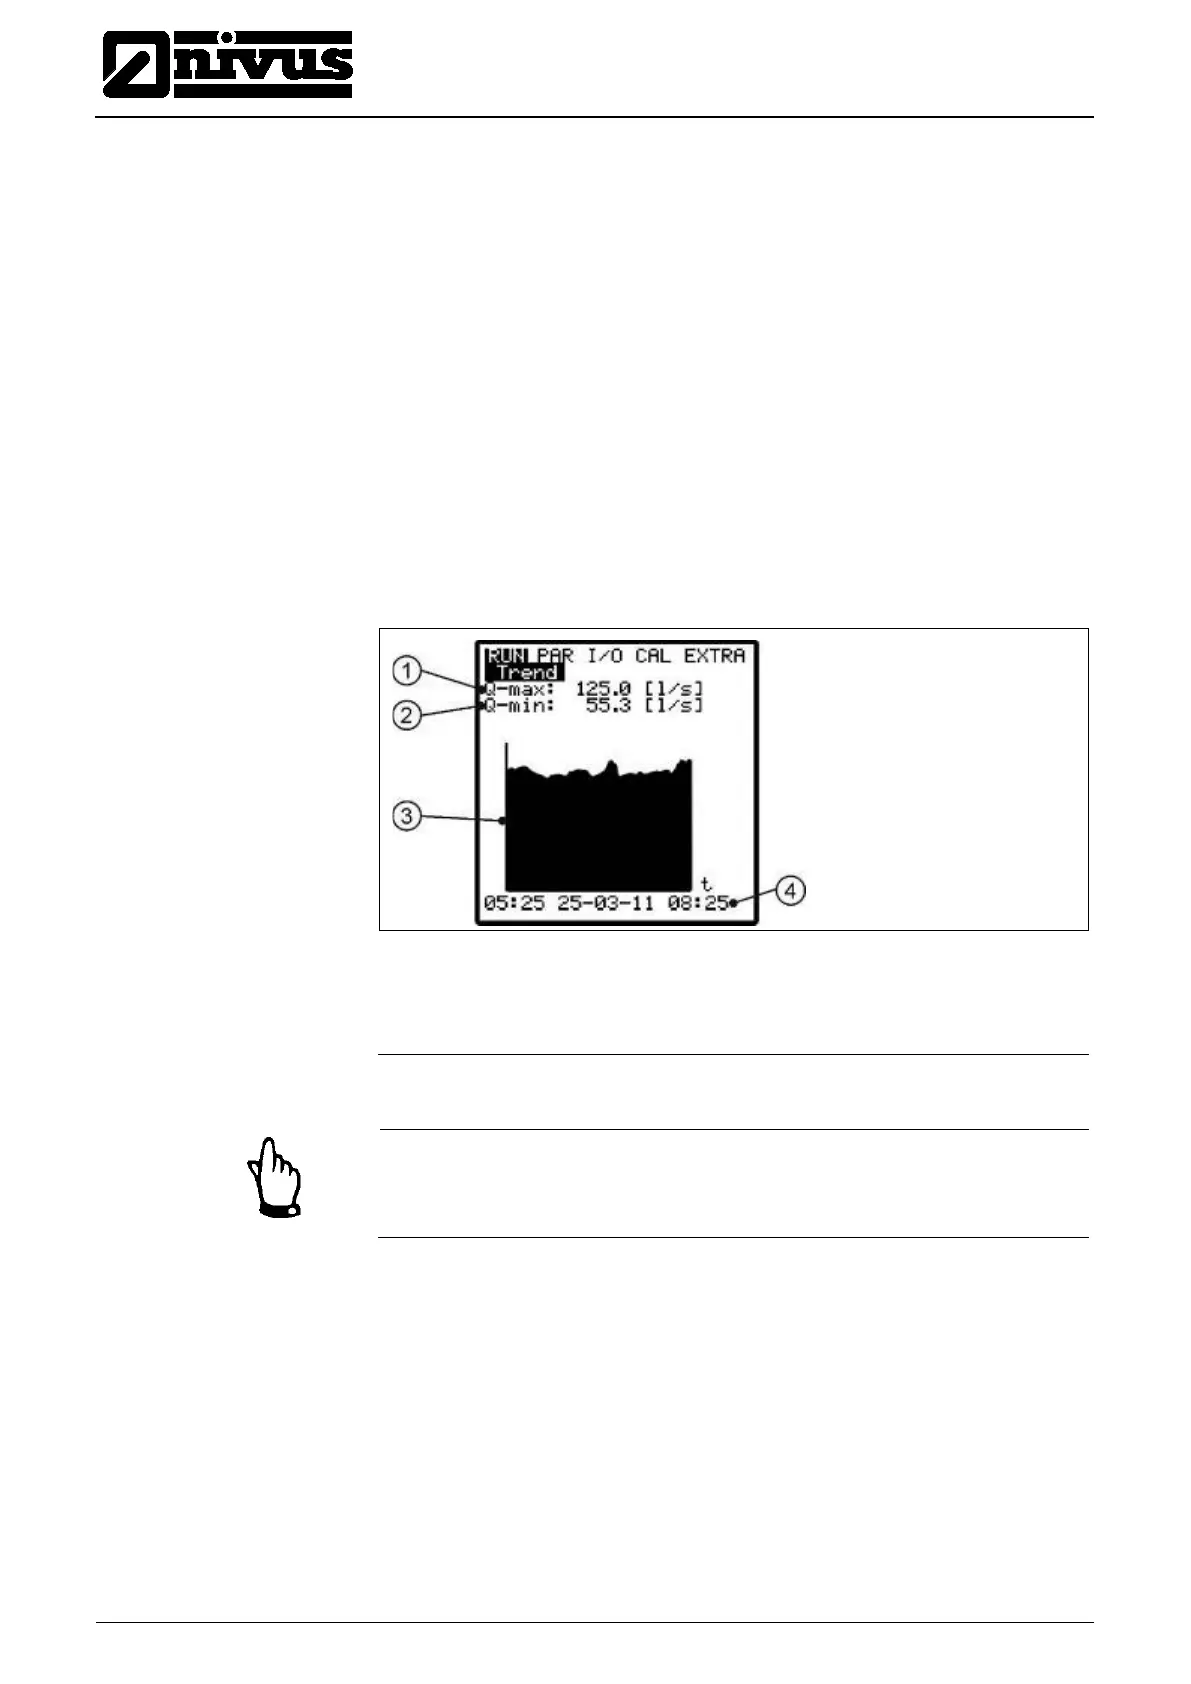
The period within which values have been averaged is indicated on the bottom
line of the graphic display. New values will be added as vertical lines on the
right-hand side each time after the programmed storage cycle has expired (see
Fig. 9-21). This is why the oldest value moves to the left-hand side of the display
and from there into the internal memory area.
By using the arrow keys >left< and >right< you can scroll within the time axis in
order to view older data sets. Browse through day values using the arrow keys
>up< and >down<. This enables to determine and to evaluate previous meas-
urements, trends, dry weather periods as well as possible measurement prob-
lems which have been occurred some days before.
The internal memory has a capacity of 90 days. Subsequently, saved data will
be overwritten erasing the oldest data sets first.
Indicated measurement values will be scaled automatically during scrolling and
therefore might change in order to ensure the best reading available.
The memory time interval can be set in the PAR - Memory Mode - Interval
menu.
1 Maximum value occurred
Fig. 9-12 Trend graph example
Note
All trend graphic values saved previously will get lost if the memory interval or
any other parameter is going to be modified.
 Loading...