2-10SectionGraphs
154
2-10 Graphs
The following three types of graphs can be used with the PT. The contents of
memory table entries are read out, and the graph display is updated, automati-
cally. If one or more words is allocated for the numeral memory table entry in the
host, changes in the word or words are continually reflected in the graph.
• Bar graphs Page 154
• Analog meter Page 158
• Broken line graphs Page 164
• Trend graphs Page 170
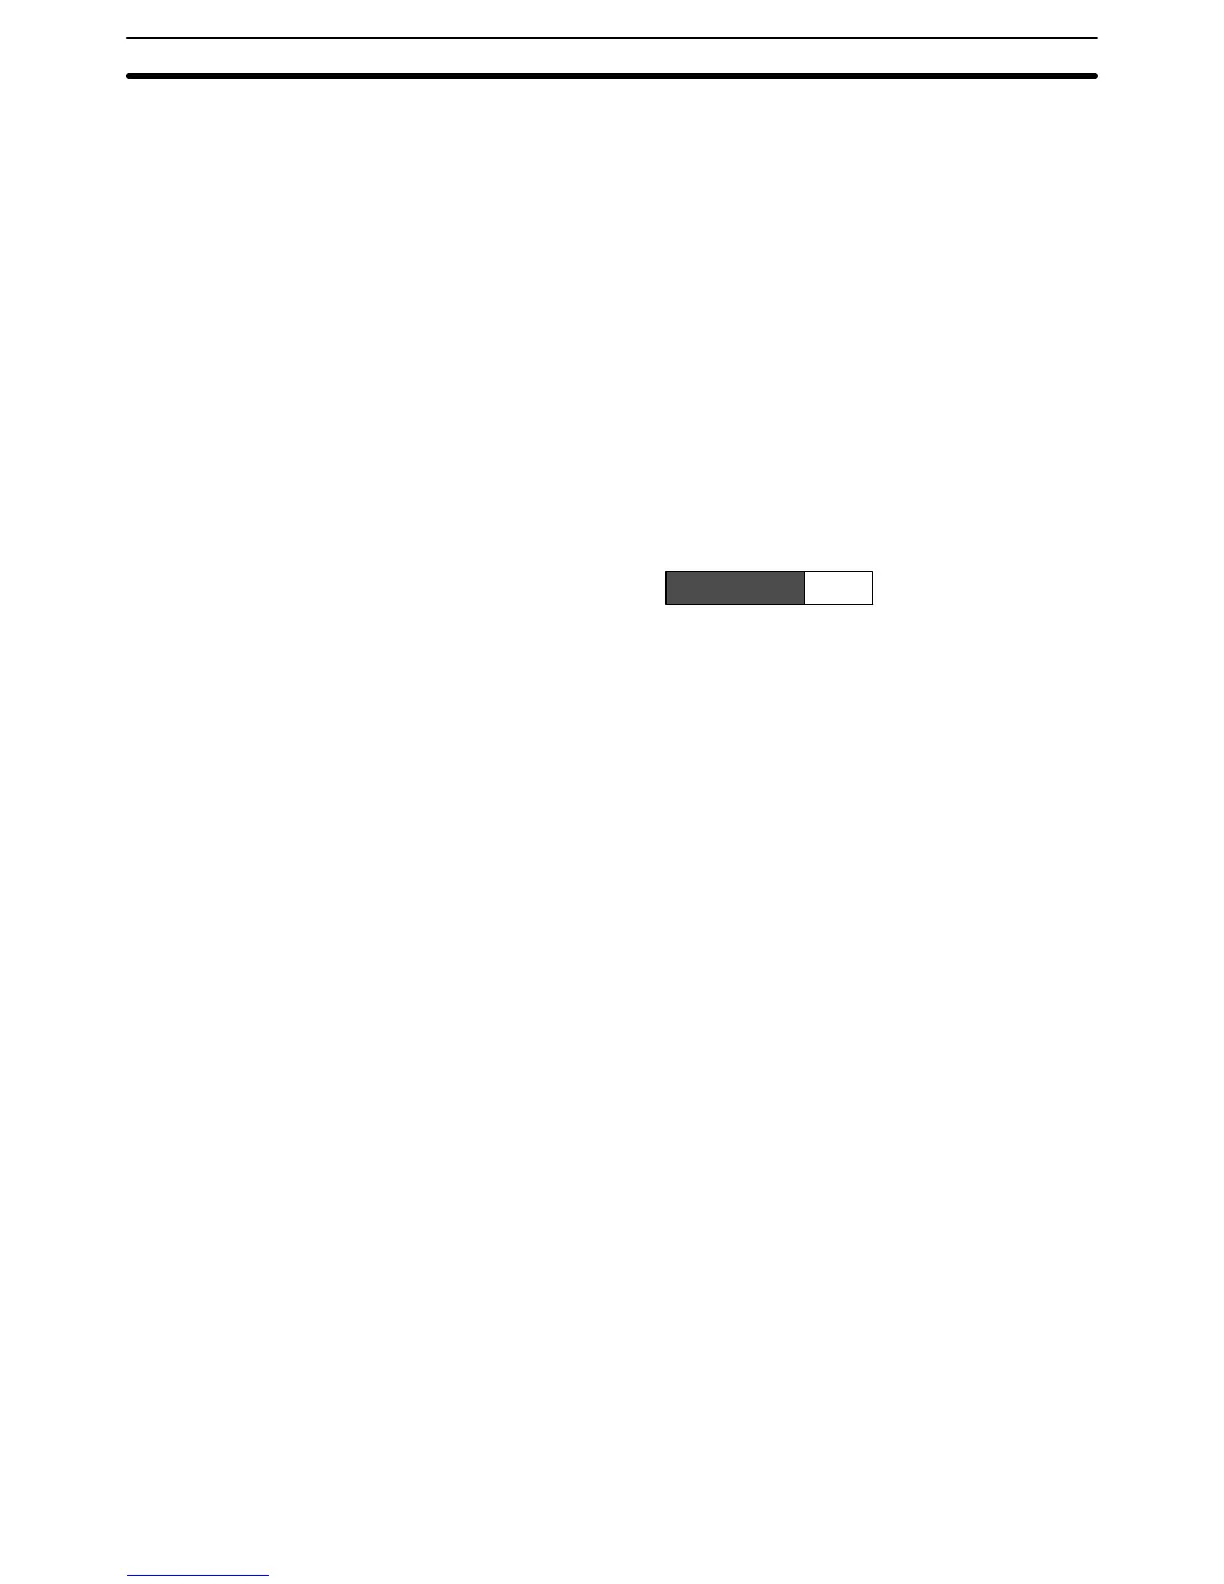
2-10-1 Bar Graphs
The contents of a numeral memory table entry is displayed in the form of a bar
graph.
The numeric value can also be indicated as a percentage of the designated nu-
meric value.
60%
Restrictions
• A maximum of 50 bar graphs can be registered for one screen. (Same for win-
dow screen.) For an overlapping screen comprising 8 child screens, the maxi-
mum is 400.
There is no restriction on the number of bar graphs that can be registered for
one screen data file: any number can be registered as long as the data file
capacity is not exceeded. However, if a large number of elements are regis-
tered, check that the restrictions on element display are complied with by
referring to Display Restrictions (page 431).
Function Outline