2-10SectionGraphs
155
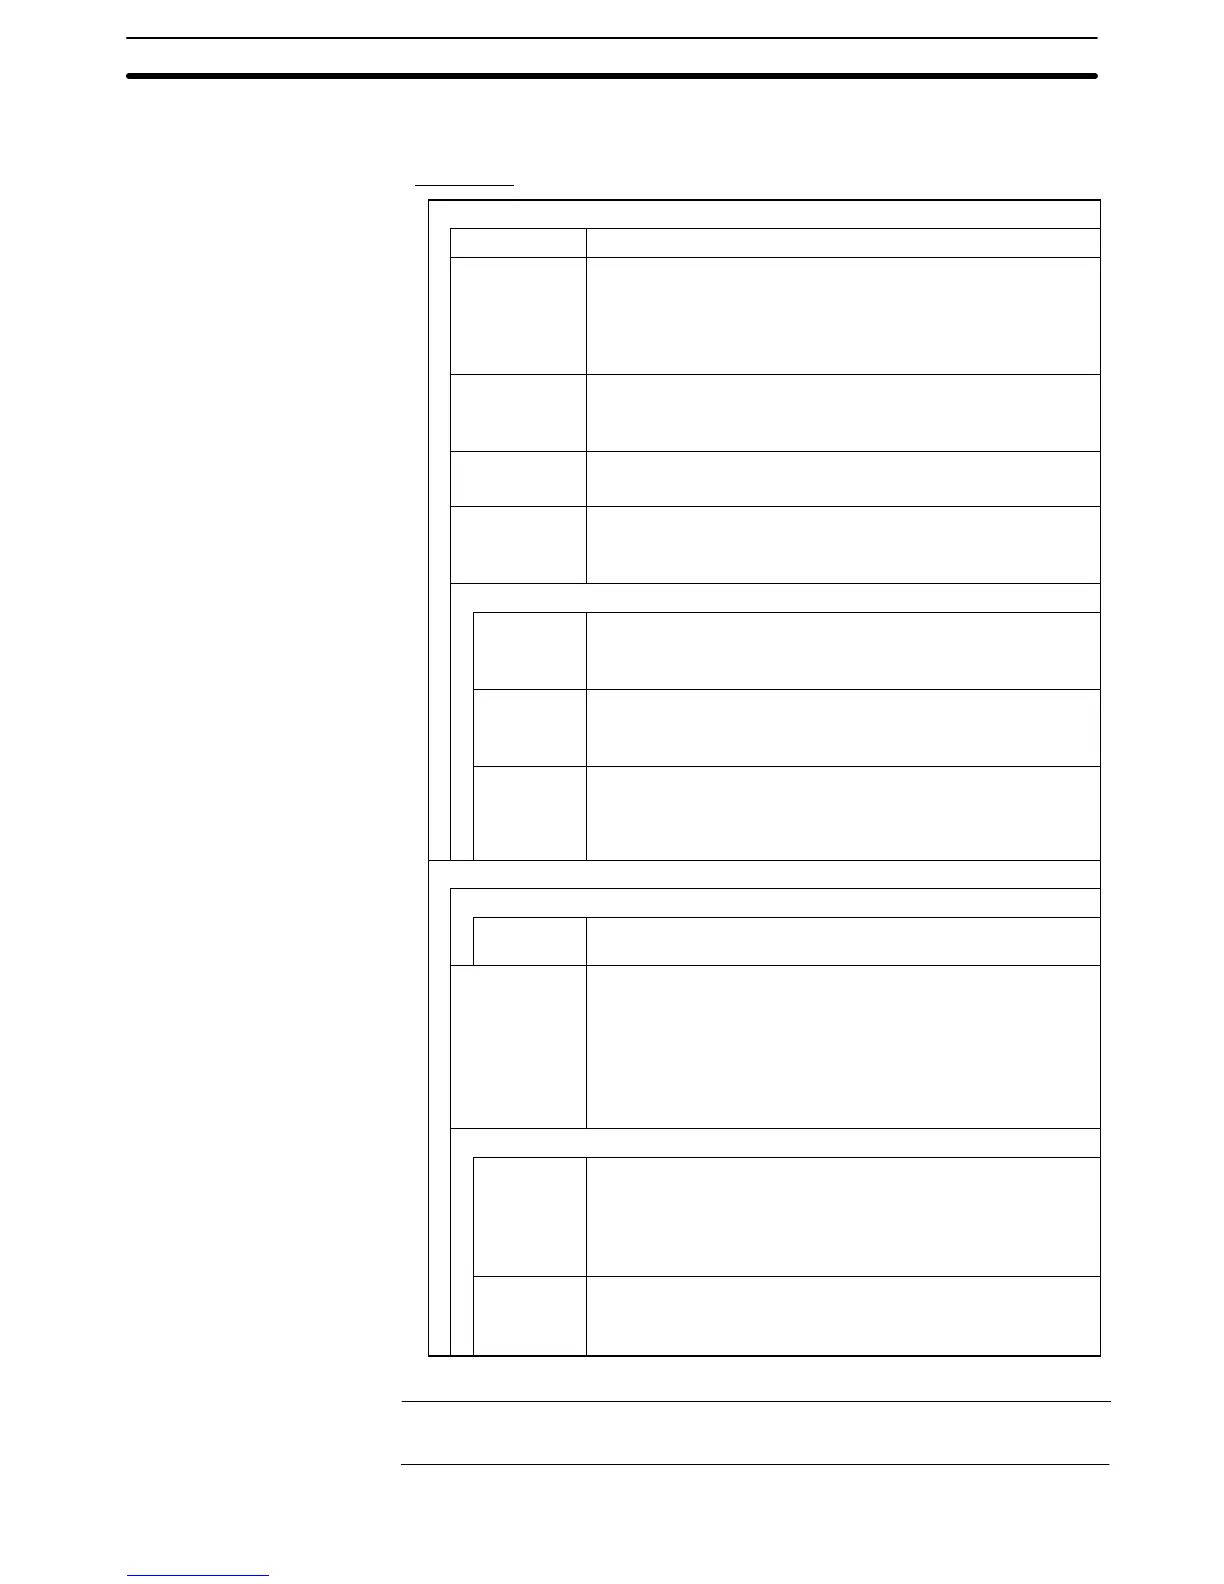
The relationship between the properties of a bar graph and the display results is
indicated below.
Properties
General
Position Coordinates of the top left corner of the bar graph area.
Size Width and height of the area in which the bar graph is displayed
(dot units)
NT21: Width: 2 to 260, Height: 2 to 140
NT31/NT31C: Width: 2 to 230, Height: 2 to 240
NT631/NT631C: Width: 2 to 640, Height: 2 to 480
Frame Whether or not a frame is displayed for the graph area
Check mark (frame displayed)/
No check mark (frame not displayed)
Display Sign Whether or not a negative area is displayed.
Check mark (displayed)/No check mark (not displayed)
Direction Direction in which the bar graph extends (Incremental Direction
of Bar Graphs, page 157)
Up/Down/Left/Right
Color
Frame Display color of the frame (Colors other than black and white are
available with the NT31C and NT631C only.)
Black/Blue/Red/Magenta/Green/Cyan/Yellow/White
+ Range Display color of the positive range (Colors other than black and
white are available with the NT31C and NT631C only.)
Black/Blue/Red/Magenta/Green/Cyan/Yellow/White
– Range Display color of the negative range (Colors other than black
and white are available with the NT31C and NT631C only.)
(effective only when a check mark is set for Display Sign)
Black/Blue/Red/Magenta/Green/Cyan/Yellow/White
Settings
Value
Table Entry Number of numeral memory table entry whose contents are to
be displayed.
Display % Presence/absence of a percentage indication of the contents of
the numeral memory table entry (Method for calculating the per-
centage value, page 157)
Check mark (percentage displayed)/
No check mark (no percentage display)
For details on the Display % properties, refer to the Text (Fixed
Display) on page 98.
100%
*1
(Specify 100% value using either of Table Entry or Value.)
Table Entry Numeral memory table entry number checked to find the
100% value for percentage calculations
Designate the number of the numeral memory table entry
that stores the 100% value.
Range: 0 to 1999
Value Checked to find the 100% value for percentage calculations
Designate the 100% value (default: 100)
Range: –2147483648 to 2147483647
Reference: The graph’s % values are always displayed with the standard display attributes.
These display attributes cannot be changed.
Common Attributes
 Loading...