2-10SectionGraphs
156
Settings
0%
*1
(Specify 0% value using either of Table Entry or Value.)
Table Entry Numeral memory table entry number checked to find the 0%
value for percentage calculations
Designate the number of the numeral memory table entry
that stores the 0% value.
Range: 0 to 1999
Value Checked to find the 0% value for percentage calculations
Designate the 0% value (default: 0)
Range: –2147483648 to 2147483647
–100%
*1
(Specify-100% value using either of Table Entry or Value.)
Table Entry Numeral memory table entry number checked to find the
–100% value for percentage calculations
Designate the number of the numeral memory table entry
that stores the –100% value.
Range: 0 to 1999
Value Checked to find the –100% value for percentage calculations
Designate the –100% value (default: –100)
Range: –2147483648 to 2147483647
*1: The –100% value, 0% value, and 100% value must comply with the following
relationship:
–100% value < 0% value < 100% value
When a table entry is specified for the % value, the relationship above will not be
satisfied if the contents of the specified numeral memory table entry are
incorrect. In this case, the graph won’t be refreshed even if the values displayed
on the graph are changed.
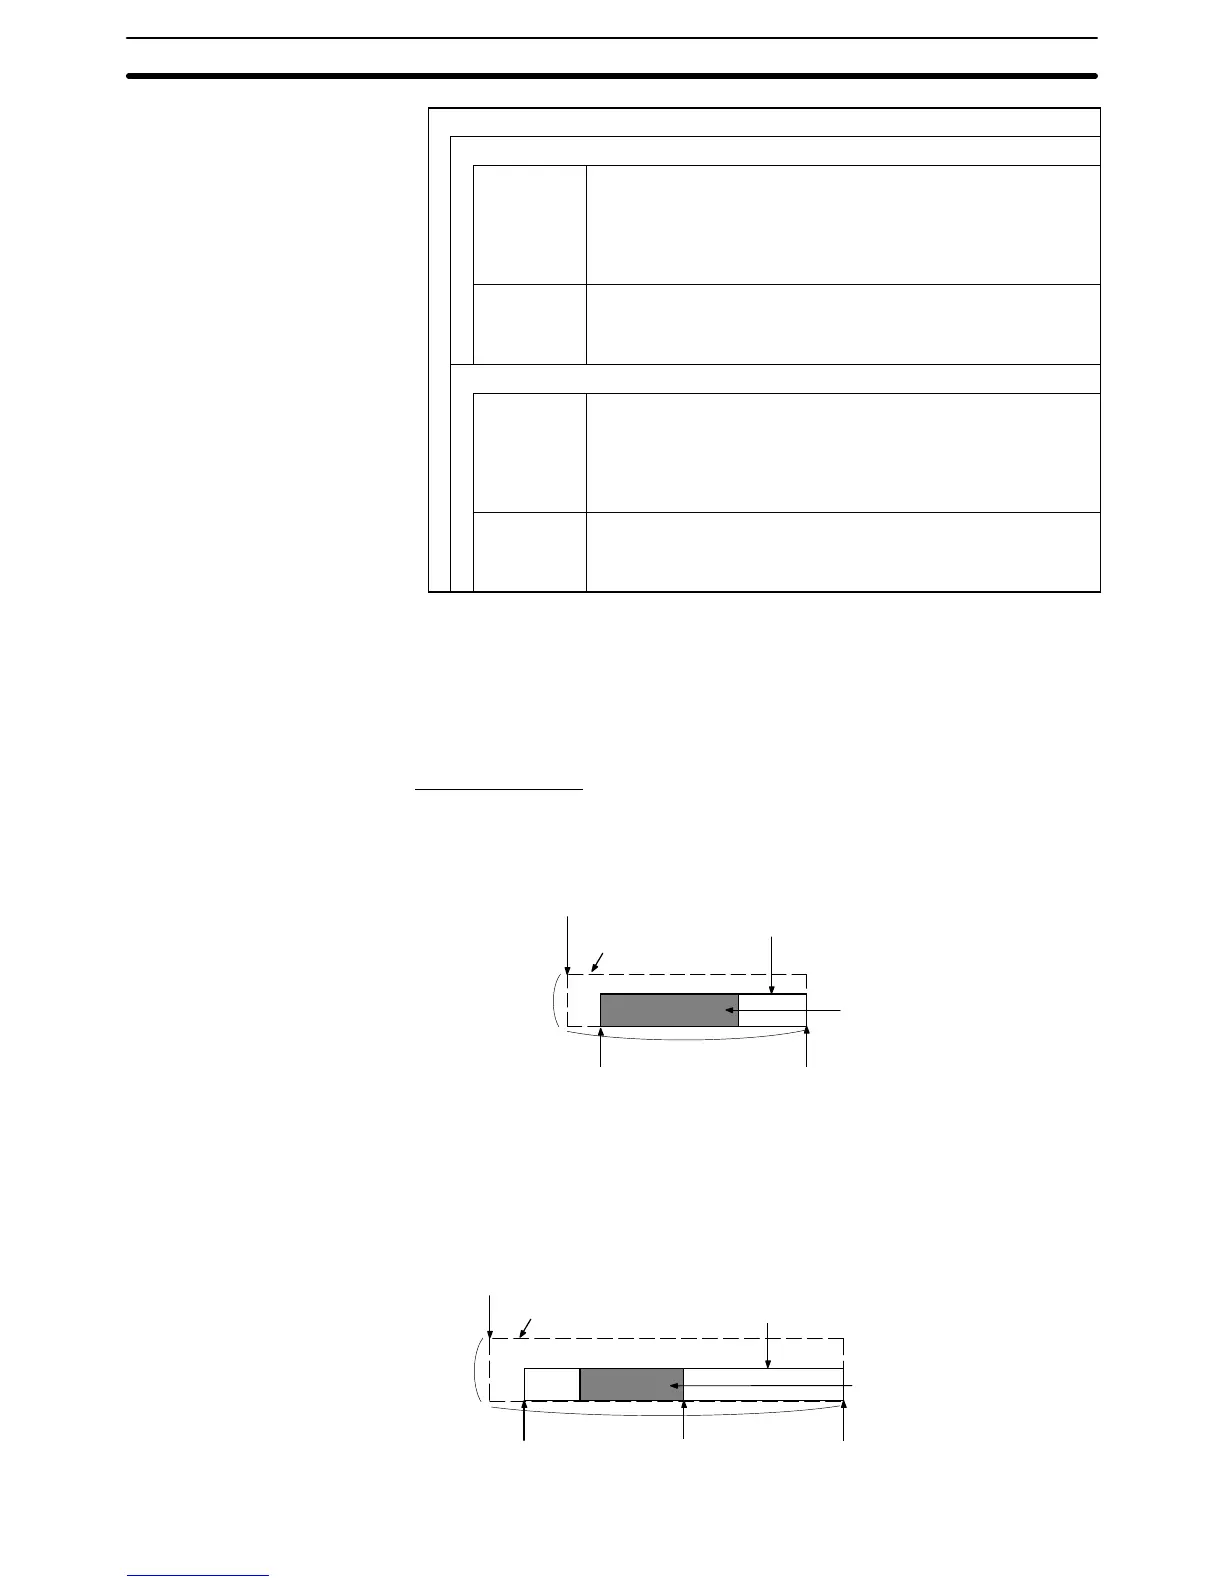
Resulting Display
When No Check Mark Is Set for Display Sign
60%
100% position
Position
(Top left corner of the rectangular area
including the graph and percentage display)
Percentage display
Display color for the + range
Frame color
Size
(Y direction)
0% position
Size (X direction)
When a Check Mark Is Set for Display Sign
In this case, the center of the graph is always the 0% position, regardless of the
settings made for 100%, 0%, and –100%.
–60%
100% position
Position
(Top left corner of the rectangular area
including the graph and percentage display)
Percentage display
Display color for the – range
Frame
color
Size
(Y direction)
–100% position 0% position
Size (X direction)
 Loading...