2-10SectionGraphs
176
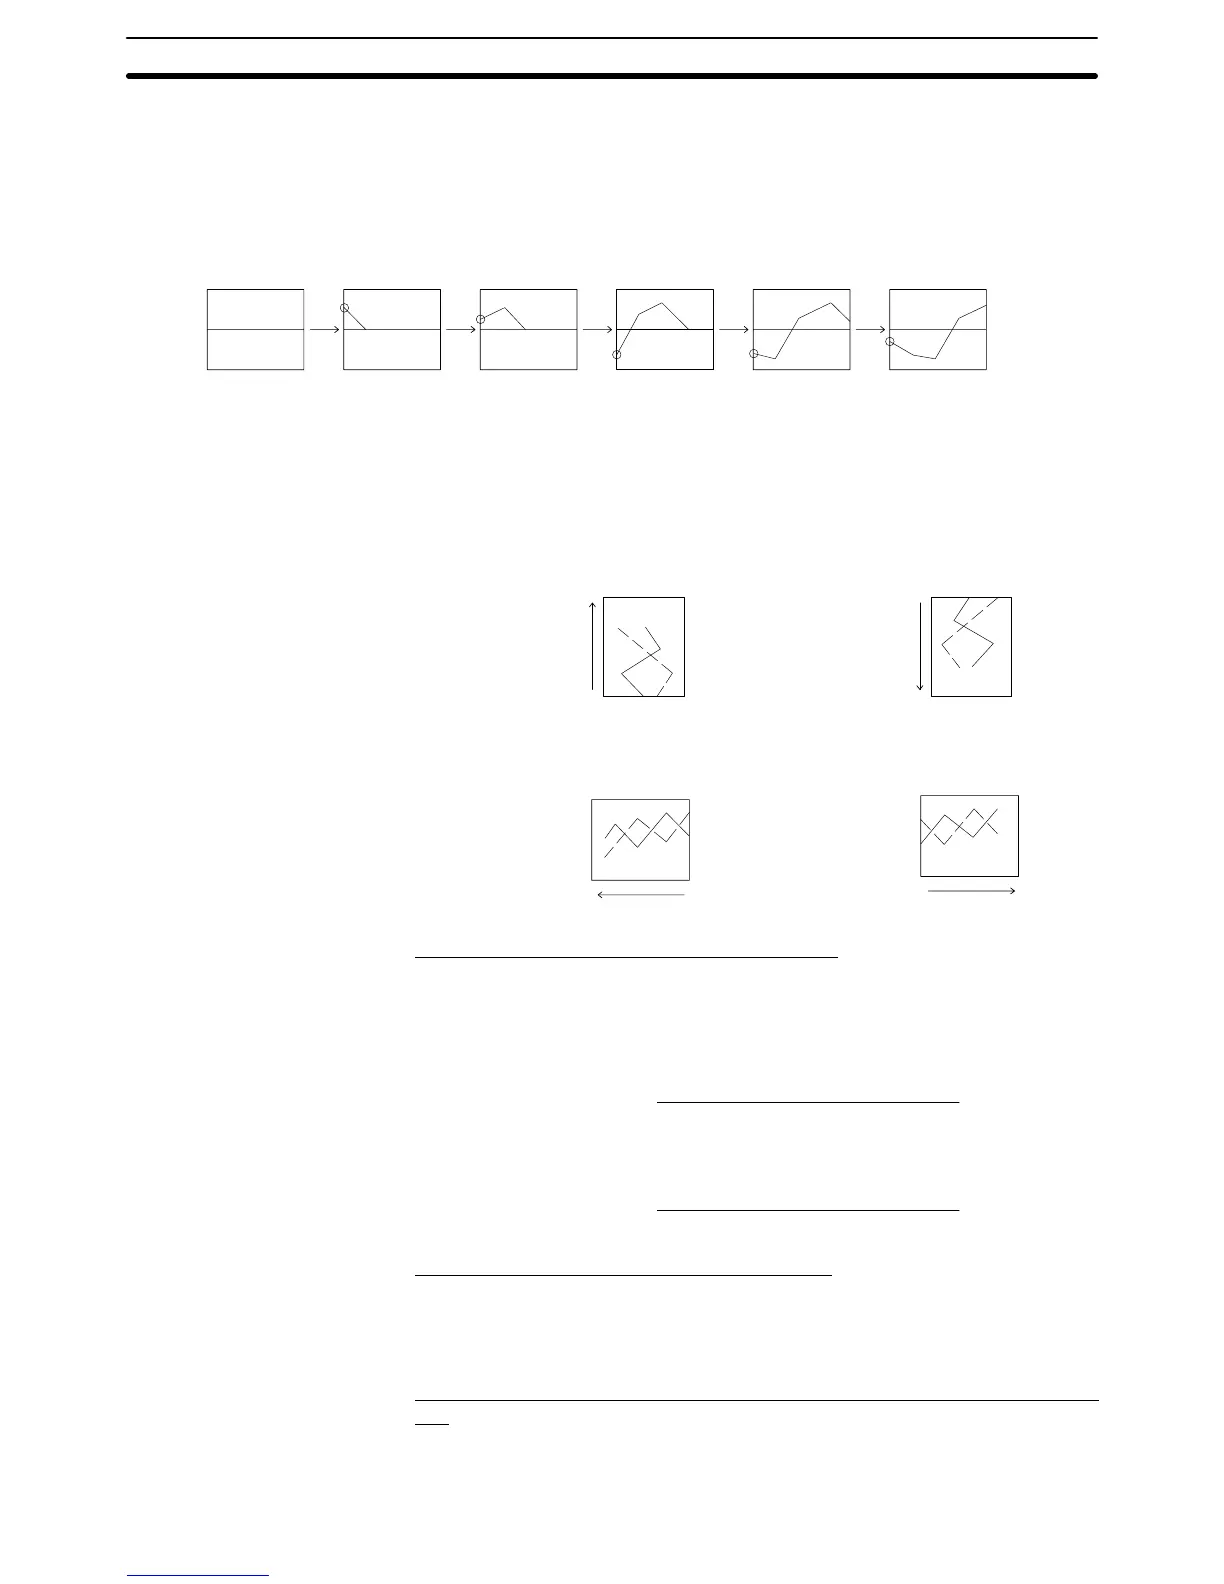
When Pen Recorder Is Set for Type
With the pen recorder type, the latest drawing position is always displayed at the
edge of the graph area. As time passes, the part of the graph that is already dis-
played moves in the direction specified by Direction (as if paper were moving
underneath a pen). When the direction of motion is right, the display changes in
the manner shown below. When the line reaches the edge of the graph area, the
data is cleared from the oldest first.
Direction of
motion →
: Latest data
To start, the PT
draws a line
from 0 to the
latest data.
: Latest data : Latest data : Latest data : Latest data
The data is
progressively
cleared, oldest
first.
The drawing results with each Direction setting are indicated below.
100% 100%
100%
100%
Up:
The drawn line moves
upward.
Direction of motion
Down:
The drawn line moves
downward.
Direction of motion
Left:
The drawn line moves
to the left.
Right:
The drawn line moves
to the right.
Direction of motion
Direction of motion
Method for Calculating the Percentage Value
The percentage value is calculated as follows, depending on whether it is larger
or smaller than the 0% value.
• When displayed numeric value 0%, or when a check mark is set for Dis-
play Sign:
Percentage value =
[100%] – [0%]
Displayed numeric value – [0%]
100
• When displayed numeric value < 0%:
Percentage value =
[0%] – [–100%]
Displayed numeric value – [0%]
100
Method for Displaying the Percentage Value
The percentage value will be displayed as a signed value regardless of the trend
graph’s Display Sign setting. The percentage value is always displayed as 5-dig-
it value: the sign character, 3-digit numerical value, and % character. (The sign
character is a blank space for positive values.)
Differences in Trend Graph Display Method According to Percentage Val-
ues
The display method of a trend graph differs according to the percentage value
range.