PicoQuant GmbH HydraHarp 400 Software V. 3.0.0.1
4.3. The Toolbar
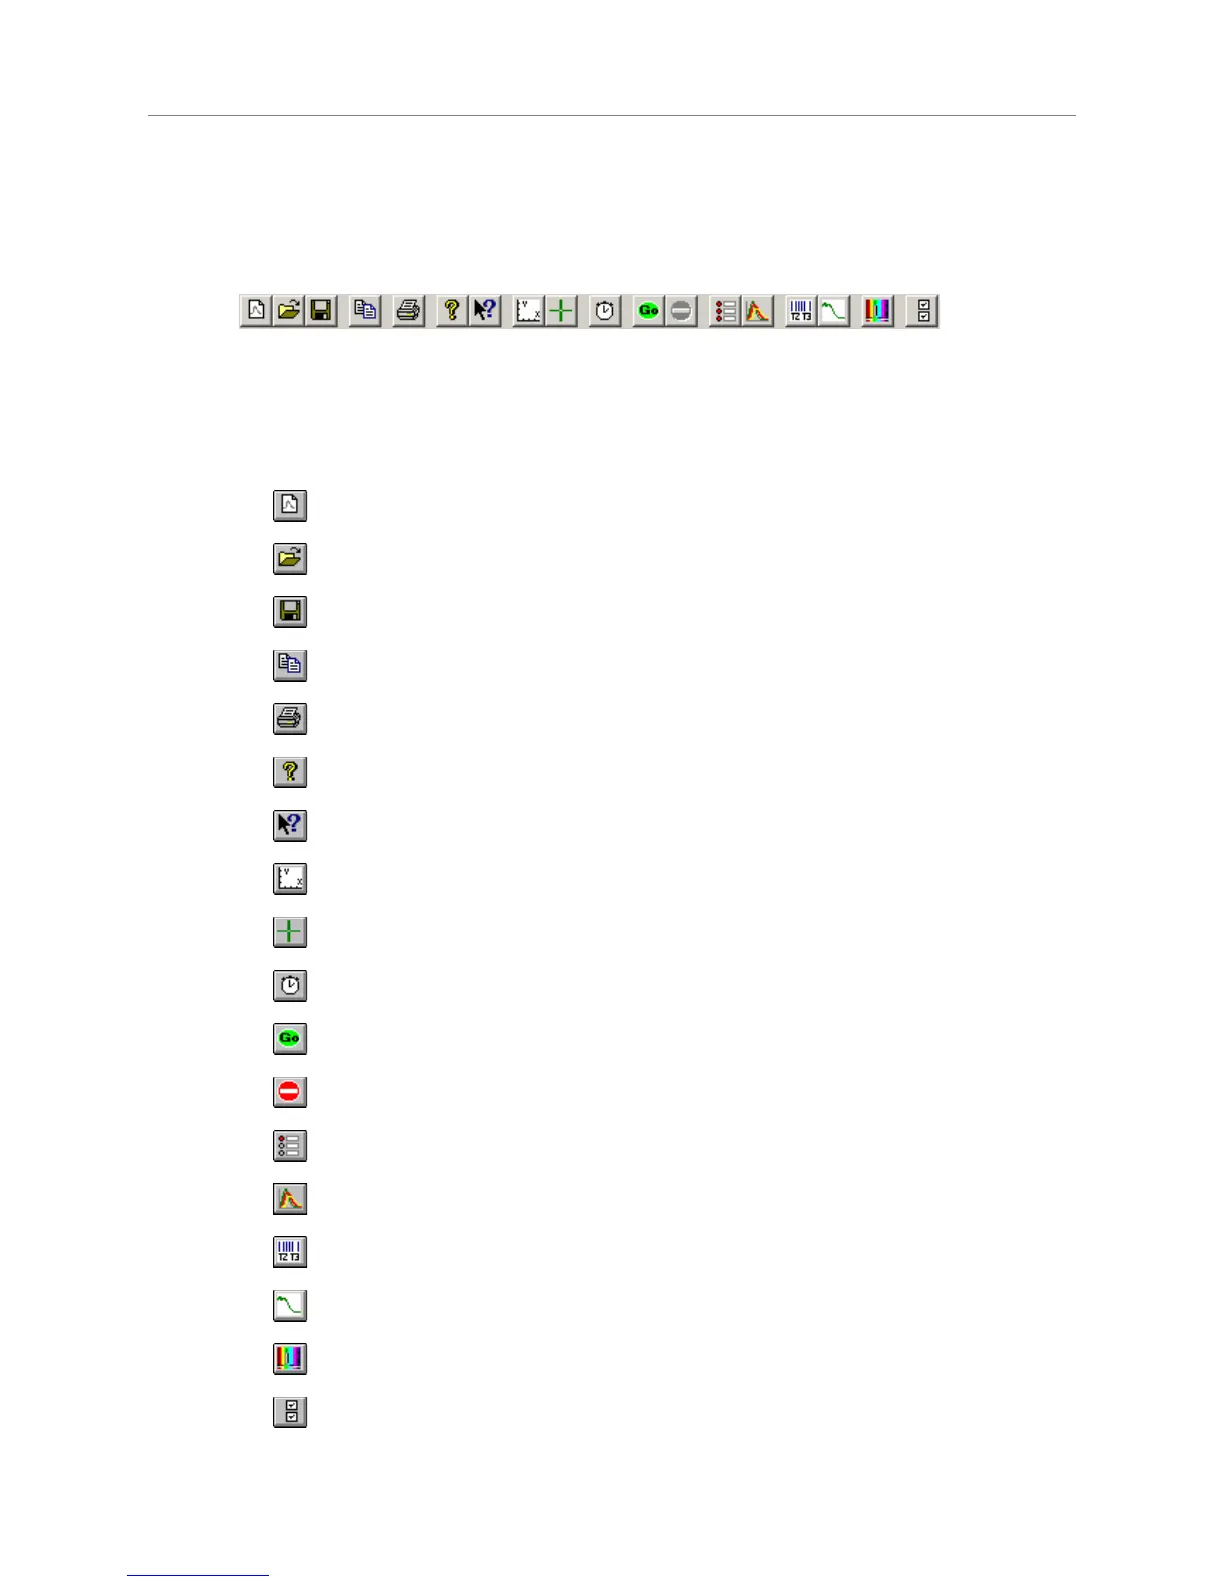
The toolbar is displayed across the top of the HydraHarp main window, below the menu bar. The toolbar
provides quick mouse access to frequently used commands and tools. Note that some buttons may be grayed
out (disabled) dependent on the installed software components and / or the state of the hardware.
To hide or display the Toolbar, choose Toolbar from the View menu (<Alt>+V T). The toolbar is capable of
‘docking’, i.e. you can move it to another edge of your window or even have it displayed as a separate window.
The following table explains the individual buttons.
Click… to…
open a blank histogram with default control panel settings
open an existing histogram file. Displays the Open dialog box, in which you
can locate and open the desired file.
save the current histogram data with its current name. If you have not named
the file, the Save As… dialog box is displayed.
copy the currently displayed curves to the clipboard (ASCII export).
print the currently displayed histogram curves.
display the About… window. This is where you can determine the version of
your HydraHarp software and hardware. Also provides links for updates etc.
activate context help.
launch the axis panel.
launch the data cursor dialog.
calibrate the time measurement hardware
start measurement based on current HydraHarp control panel settings
stop measurement and histogram accumulation.
launch the HydraHarp control panel.
launch the trace mapping dialog.
launch the TTTR mode dialog.
Launch the TTTR mode real–time correlator dialog.
launch the dialog for monochromator control and TRES setup.
launch the general settings dialog.
Page 21