PicoQuant GmbH HydraHarp 400 Software V. 3.0.0.1
5.2. Setting Up and Running Interactive Measurements
The primary mode of operation of the HydraHarp software is interactive histogramming mode. This is what the
main window of the software is dedicated to. The user can set up measurement parameters, start
measurements and immediately see histogram data on the screen. In further sections, e.g. on TTTR mode, you
will learn about other modes of operation with less user interaction that will collect data straight to disk without
immediate visualization. Here, we focus on the interactive histogramming mode of operation.
To set up measurement parameters use the HydraHarp control panel. The control panel
can be opened by clicking the control panel button on the toolbar or by pressing <Alt>+C.
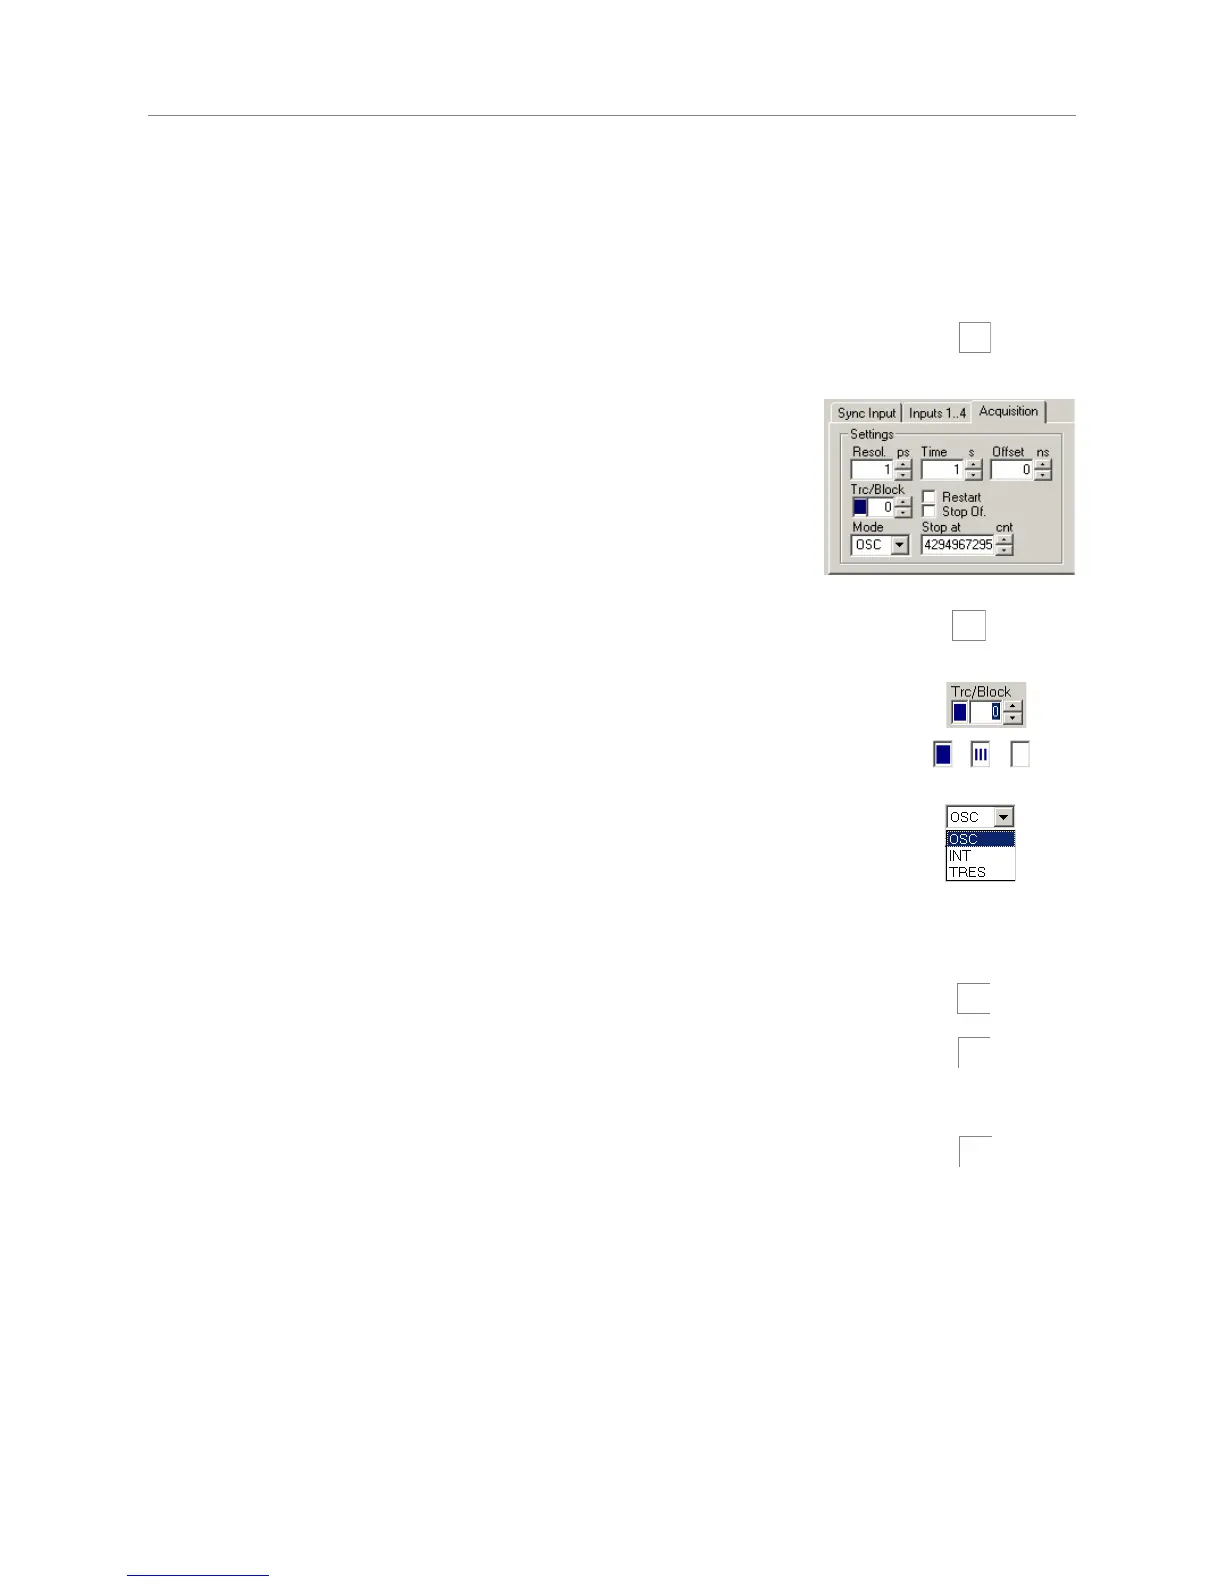
In the control panel section 'Acquisition' you can set the resolution (time per
bin), the offset, the measurement time, and the block of memory to use for
this measurement. To begin, use a measurement time of 1 second and an
offset of 0. There are always 65,536 time channels (bins) per HydraHarp
histogram. Histograms can be measured in 512 memory blocks. Out of these
up to 8 curves can be displayed and one ‘active curve’ can be used for a
measurement. You can designate the active memory block you wish to use for
the next measurement by selecting the block number in the control panel.
Never forget to select a new block when collecting new data and old data is
intended to be preserved.
Use the trace mapping dialog to select up to 8 curves for display. Make sure the memory
block you measure into is mapped to a display trace that is switched on, so that you can
see the trace. You can reach the trace mapping dialog from the toolbar or by clicking on
the trace colour indicator next to the block selector.
The colour indicator shows the trace colour the chosen block is currently mapped to. If it
is a solid square, the curve is mapped and shown. If it is mapped but not shown, the
indicator shows a small striped square. If the curve is not even mapped for display the
indicator remains white.
There are two basic histogramming modes for interactive measurements: Oscilloscope
and Integration mode. Oscilloscope mode repeatedly collects histograms with a fixed
measurement time and displays them on the screen. This lets you see fast changes in the
histogram, e.g. for optical setup and adjustments. Usually this only makes sense with
relatively strong signals and short acquisition times. Integration mode is usually operated
with longer acquisition times. In this case the histogram continues to grow over a longer
time and the display is updated at regular intervals, so that the accumulation process can
be observed.
To start a measurement with the current control panel settings, use the start button (GO)
on the toolbar or press <Alt>+G.
To stop a measurement use the stop button on the toolbar or press <Alt>+S.
Note that a measurement may automatically stop and / or restart, dependent on the
current settings of ‘stop on overflow’ and ‘restart’ in the control panel.
Note: to actually run a meaningful measurement you will need to set up the input
channels, most importantly with appropriate CFD levels as outlined in the previous section.
Also allow a warming–up period of 20 to 30 minutes dependent on lab temperature before
using the HydraHarp for final measurements. You can use this time for set–up and
preliminary measurements. Click the calibrate button after warming up.
The rate meters (bottom of main window) permit visual control of the data acquisition. Note the selector at the
right of the rate meters. This selects the channel the rate meters are referring to. Select the channel you are
currently using. The meters are often too small to view from further away, e.g. when adjusting the optical setup.
You can in this case simply double–click the rate meter of interest. This opens a large meter display that you
can then size and move on the screen as you like.
Once you have established standard settings for your experimental setup you may want to save them to a file.
The control panel settings can then be recalled at any time. The program stores all settings together with the
histogram data of those curves in memory (max. 512) that have been filled by a measurement. In addition to
this, all settings are memorized in the Windows registry, so that at program startup you find the control panel as
it was when you last closed the HydraHarp software.
Page 29