PicoQuant GmbH HydraHarp 400 Software V. 3.0.0.1
6.6. Trace Mapping Dialog
The HydraHarp software can measure histograms in up to 512 memory blocks. Out of these, up to 8 curves
can be displayed. The trace mapping dialog is used to select the curves to display. Tick the individual boxes
‘Show’ to display a curve. Select the number of the memory block you wish to map the individual display curve
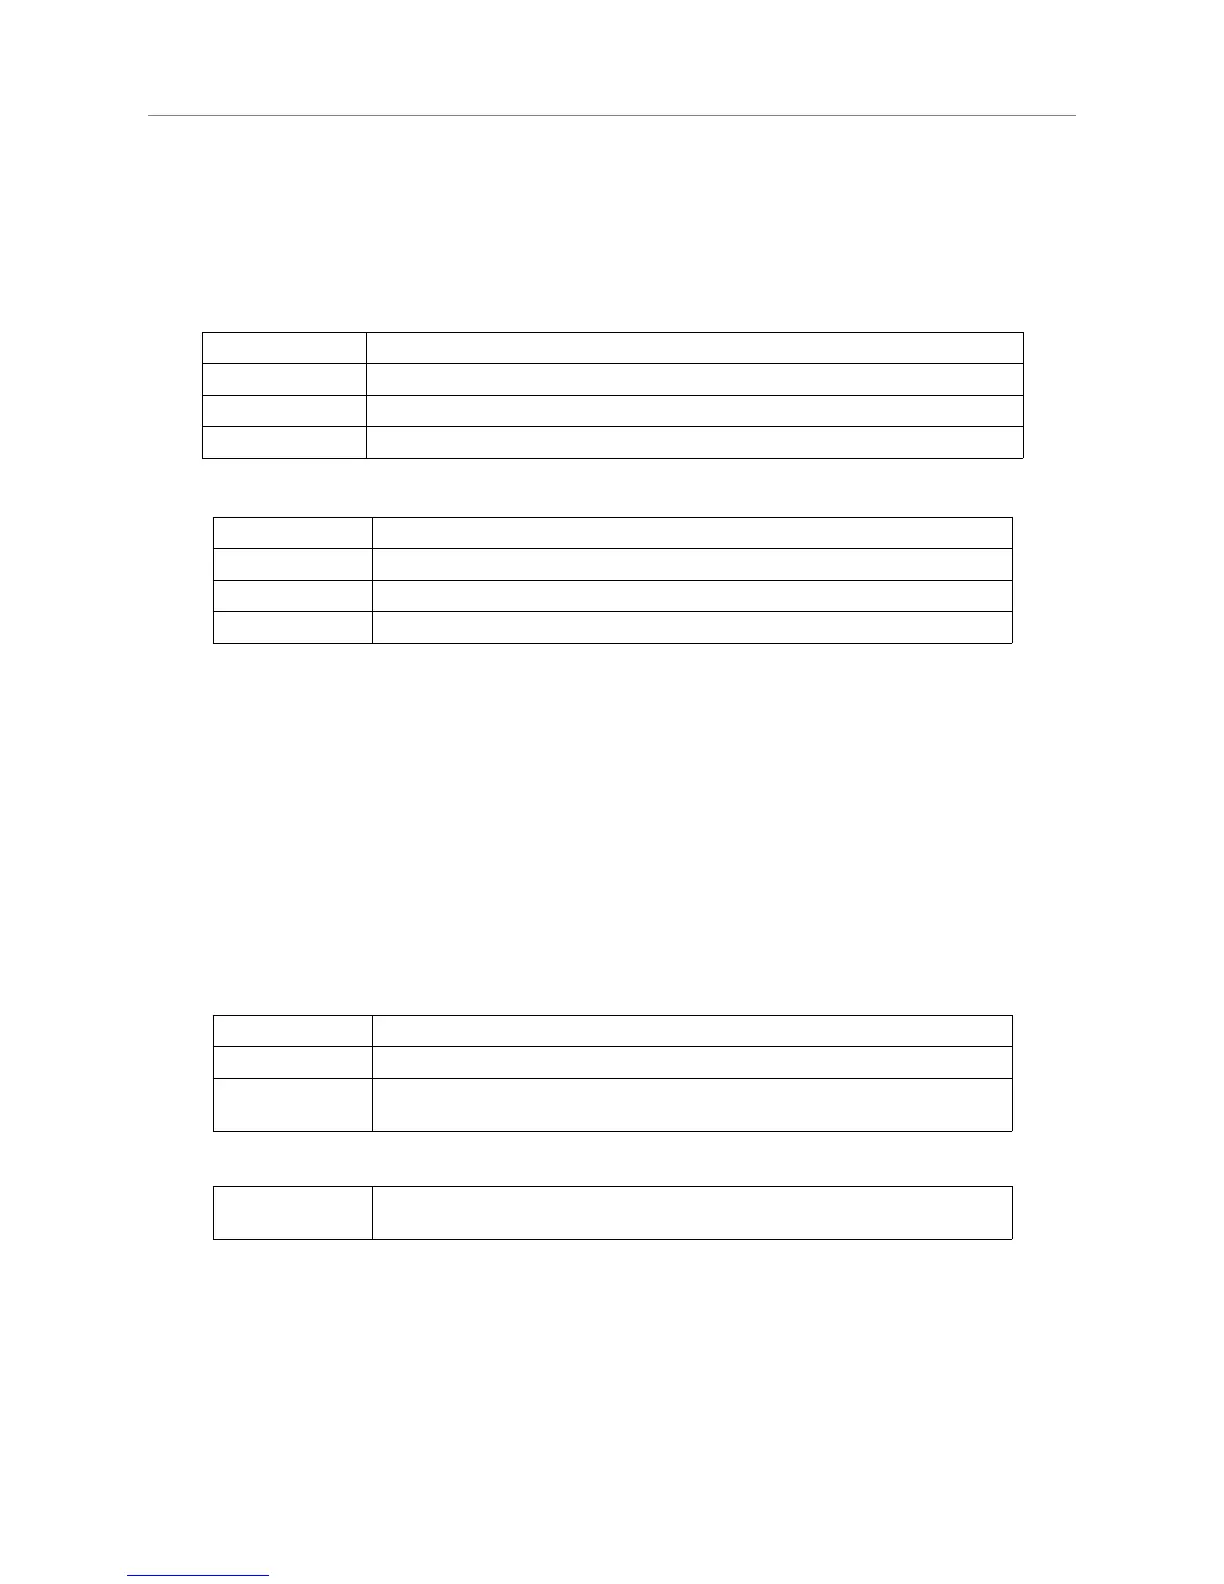
to. The Trace Mapping Dialog also provides some statistics on each curve. These items are:
FWHM The Full Width Half Maximum of the curve peak (usually for IRF traces)
Max Count The count in the highest point of the curve
At Time The time corresponding to the Max Count channel
Resolution The channel width (time bin width) of the curve
Furthermore there are several buttons:
Details Can be clicked to see more curve information
All Can be clicked to tick all traces as shown
0..7 Can be clicked to set the default mapping of trace 0..7 to block 0..7
Clear (trash can) Can be clicked to delete the contents of individual blocks
The trace mapping dialog can be launched from the corresponding button on the toolbar as well as through the
trace colour indicator on the control panel.
6.7. General Settings Dialog
Use this dialog to change standard settings of the HydraHarp software. Notably these are: Prompt overwrite
(warning before overwriting existing data) and TTTR Marker Settings. The control connector of the HydraHarp
400 provides TTL inputs for synchronization signals. The markers can be enabled resp. disabled and recorded
at the rising or falling edge of the corresponding TTL signal. The active edges can be chosen here. All settings
will be kept in the Windows registry and will be retrieved at the next program start. They will be individual to
each user.
The dialog's controls are grouped as follows:
Display Group
Display Rate /s Sets the time interval between display updates from (0.1s to 1s).
Draw mode Switches between different curve draw–modi (Lines / Stairs).
Grid Checked: The curve display is grated with a light–grey grid
Unchecked: The axes of the curve display are marked with ticks
File Saving Group
Prompt overwrite Activate this check box if you wish to be prompted before saving data over
existing data in a file (recommended).
Warnings Group
Here you can selectively enable/disable individual warnings. Activate the check box for each warning you wish
to receive. See section 8.1 for details.
Page 55