Pulsar Model 22 User Manual
Page 44
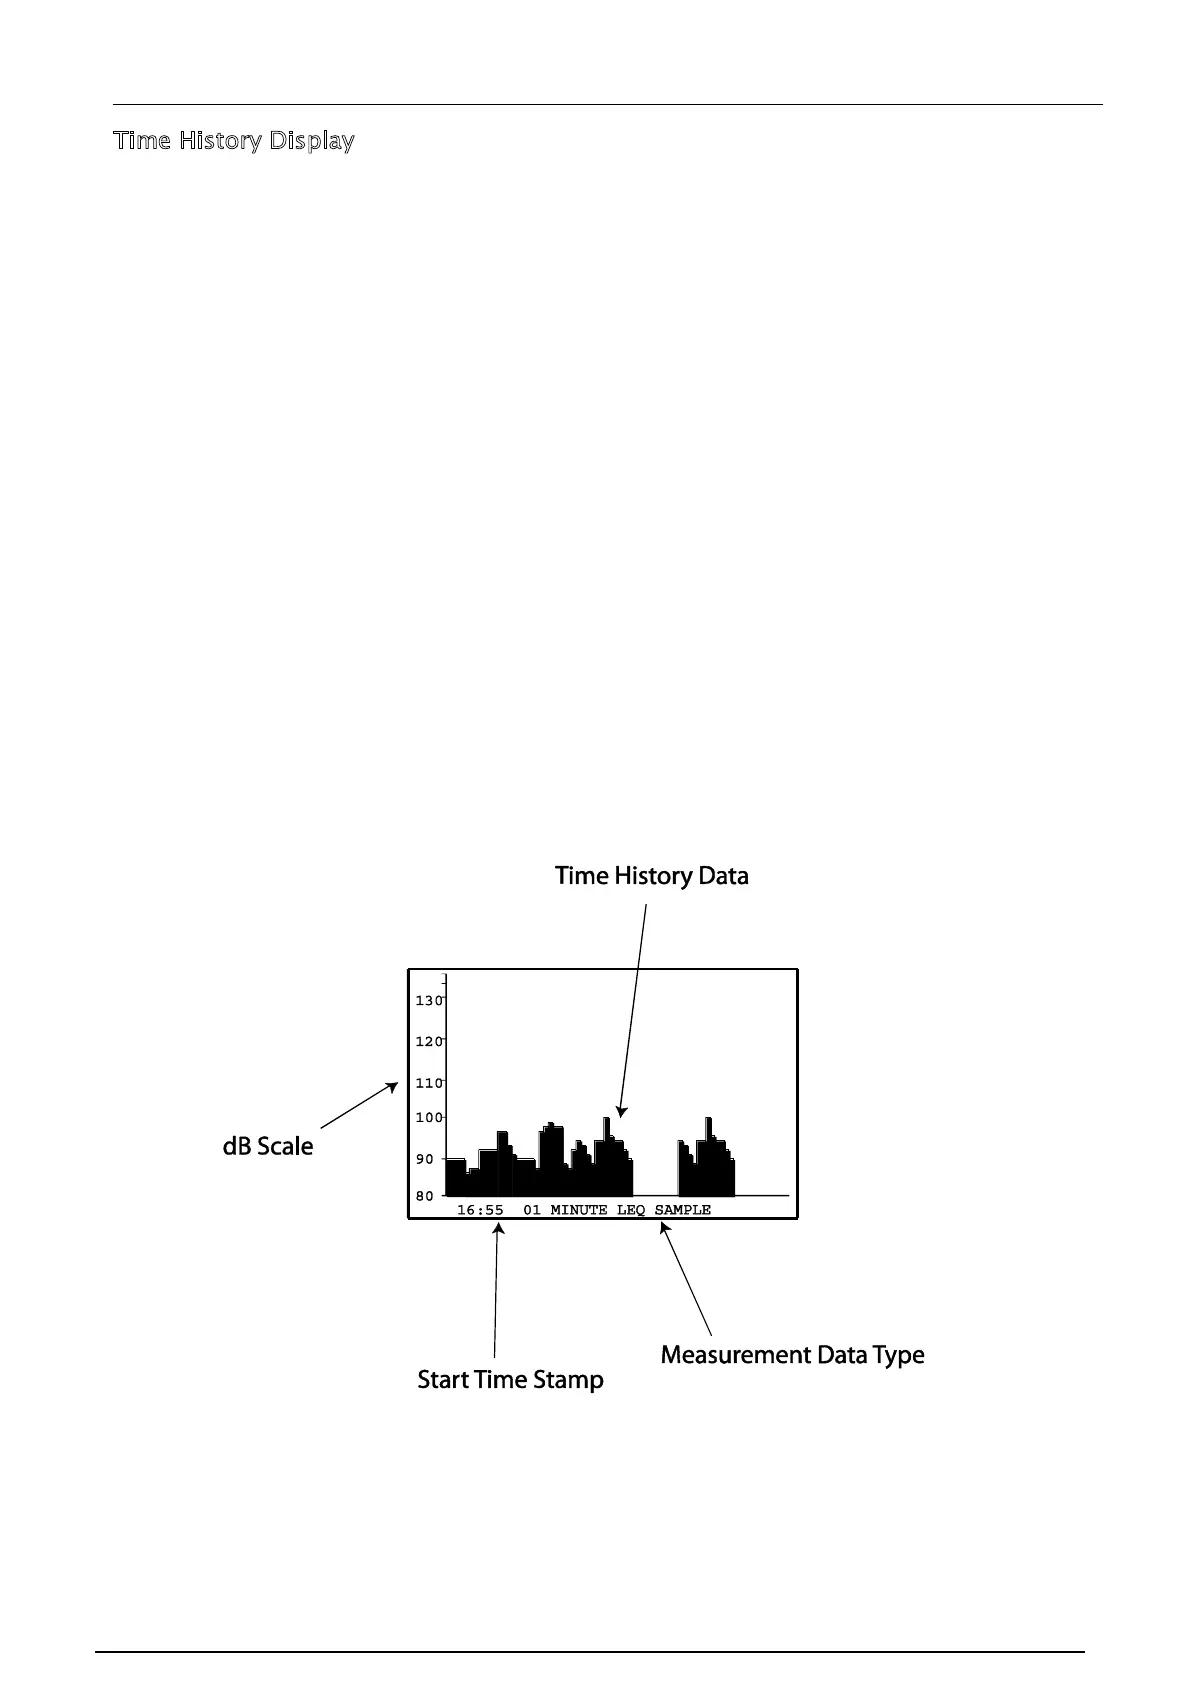
Time History Display
The measured Time History Data is displayed on the Reader display.
The Time History graph is drawn with a fixed range of 80dB to 130dB in 10dB steps
with a marker at 133dB (for overload).
If the measurement was paused, the display will show a solid bar over the full height of
the display.
The stored time history data is compressed into a sample size so that the entire time
history will be displayed on a single graph. For example, a 3 hour 50 minute
measurement will be displayed as 2 minute Leqs to allow all of the measurement
information to be shown on the display.
The graph also displays the start time of the Time History and the sample size.
The figure below shows an example of a Time History measurement. The Time History
display is either Leq for 3dB Exchange Rate, No Time Weighting and no Threshold, or
L
AVG
for any other configuration.