Common Analysis and Display Functions
R&S
®
FSVA3000/ R&S
®
FSV3000
498User Manual 1178.8520.02 ─ 01
9.5.2 Spectrograms
9.5.2.1 Working with Spectrograms
In addition to the standard "level versus frequency" or "level versus time" traces, the
R&S FSV/A also provides a spectrogram display of the measured data.
A spectrogram shows how the spectral density of a signal varies over time. The x-axis
shows the frequency, the y-axis shows the time. A third dimension, the power level, is
indicated by different colors. Thus you can see how the strength of the signal varies
over time for different frequencies.
Three-dimensional spectrograms are also available and are described in "Three-
Dimensional Spectrograms" on page 502. Most basic information described in the fol-
lowing sections applies similarly to both two- and three-dimensional spectrograms.
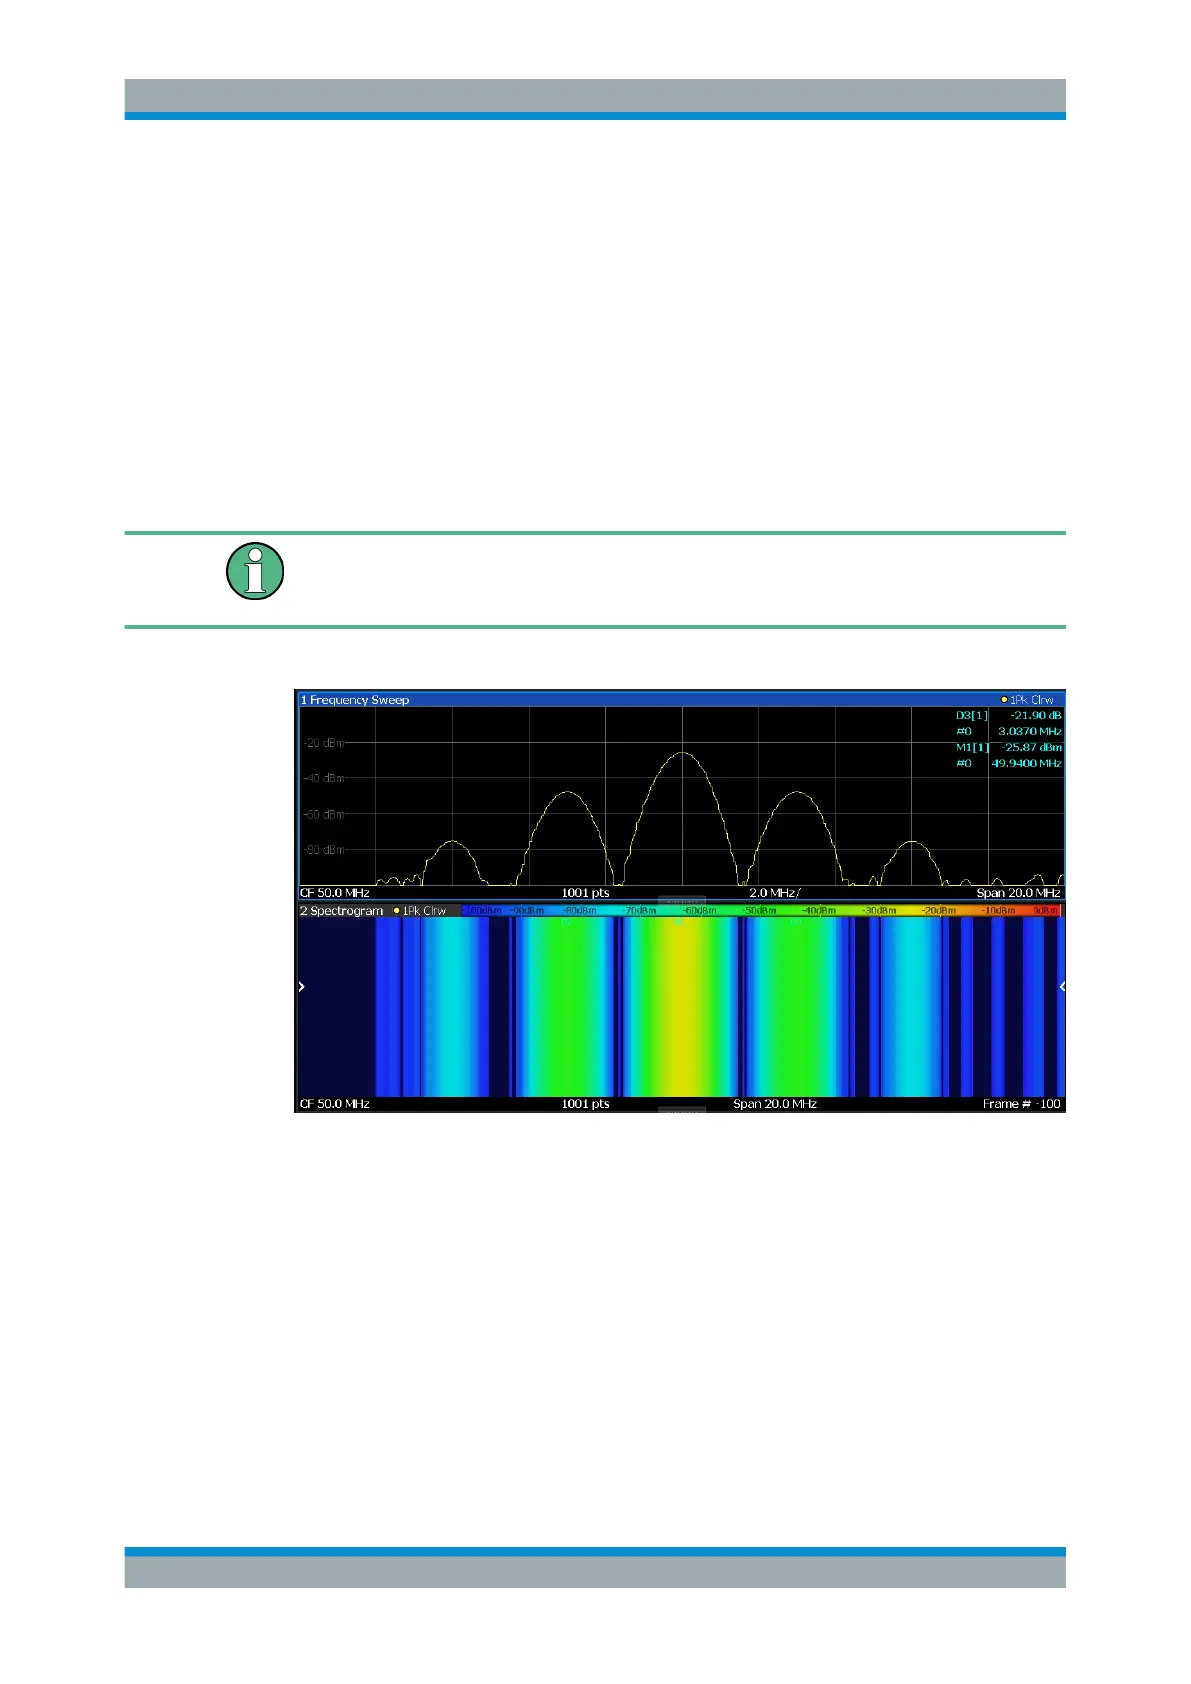
Example:
In this example, you see the spectrogram for the calibration signal of the R&S FSV/A,
compared to the standard spectrum display. Since the signal does not change over
time, the color of the frequency levels does not change over time, i.e. vertically. The
legend above the spectrogram display describes the power levels the colors represent.
Result display
The spectrogram result can consist of the following elements:
Trace Configuration