13
4.5. Graph modes
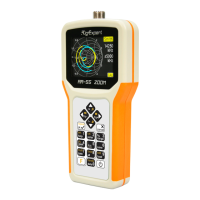
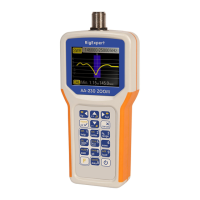
A key feature of RigExpert antenna analyzers is ability to display various parameters of
a load graphically. Graphs are especially useful to view the behavior of these
parameters over the specified frequency range.
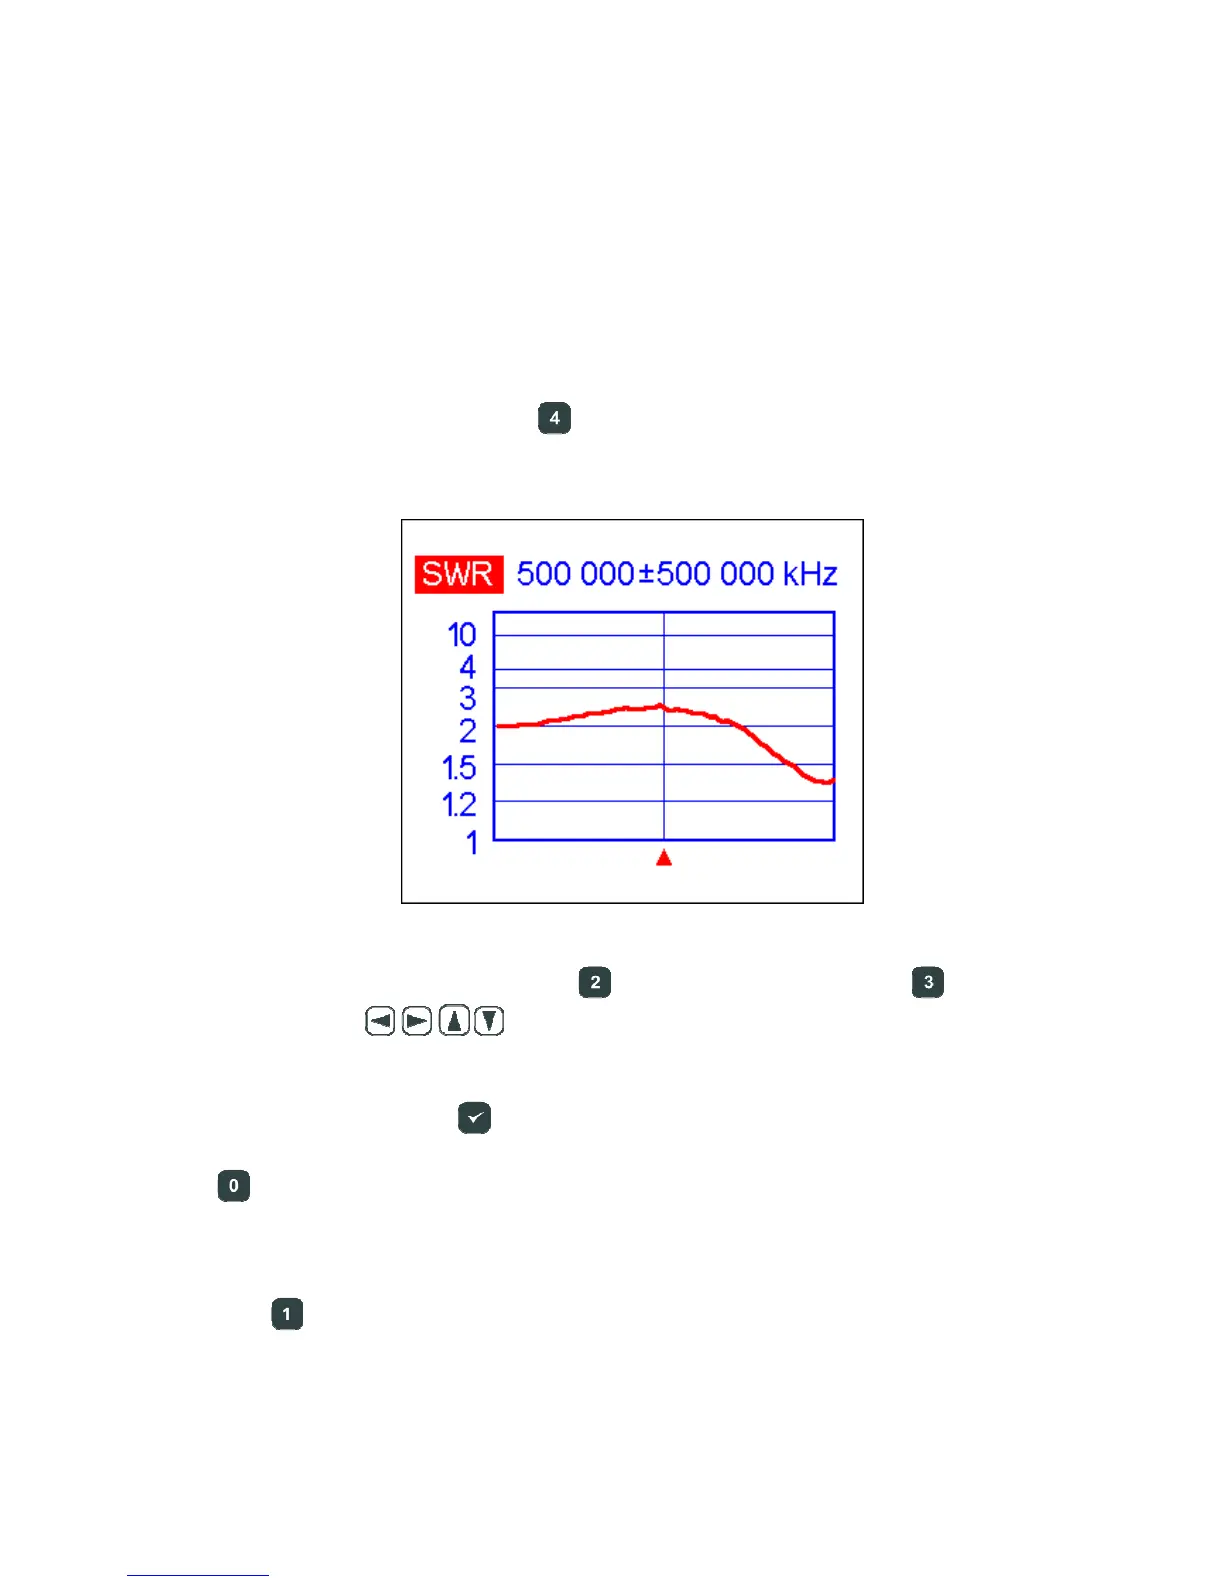
4
.5.1. SWR graph
In the SWR graph mode (press the key in the Main menu), values of the Standing
Wave Ratio are plotted over the specified frequency range:
You may set the center frequency (the
key) or scanning range (the key). By
using arrow keys (
), these parameters may be increased or decreased.
Watch the triangle cursor below the graph.
Do not forget to press the (ok) key to start measurement or refresh the graph.
The
key opens a list of radio amateur bands to set the required center frequency and
scanning range quickly. Also, you may use this function to set the whole frequency
range supported by the analyzer.
Press the
key to access a list of additional commands for this mode.