14
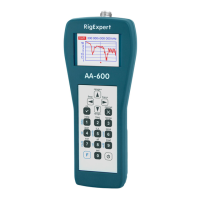
4.5.2. R,X graph
In the R,X graph mode (press the key in the Main menu), values or R (active part of
the impedance) and X (reactive part) are plotted in different colors.
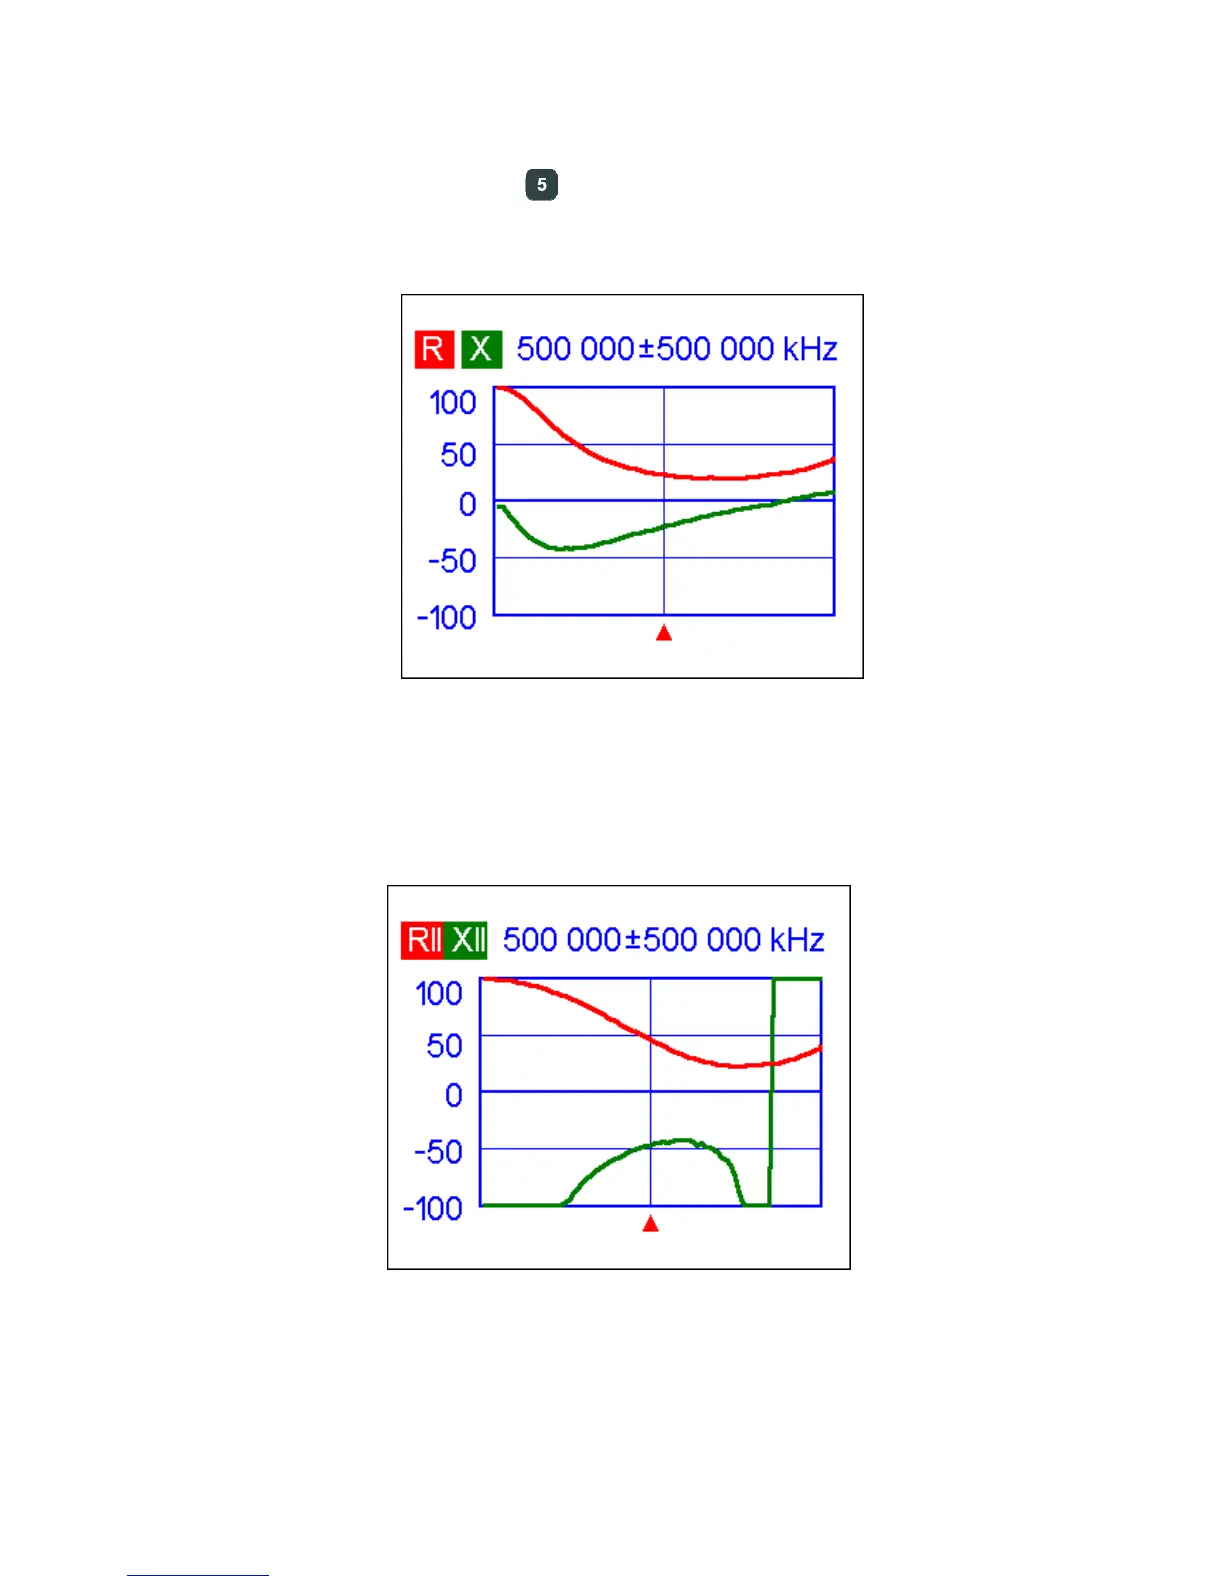
In these graphs, positive values of reactance (X) correspond to inductive load, while
negative values correspond to capacitive load. Please notice the difference in the plots
when series or parallel model of impedance is selected through the Settings menu: