15
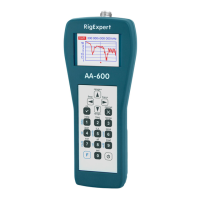
4.5.3. Smith/polar chart
The S
mith/polar chart (press the
+
key combination in the Main menu) is a
good way to display reflection coefficient over the specified frequency range:
Do not forget to press
the (ok) key to start measurement or refresh the graph.
As usual, press the key for a help screen.
Please notice: Non-US version of analyzers will display Smith chart; a polar chart is
displayed instead on US version.
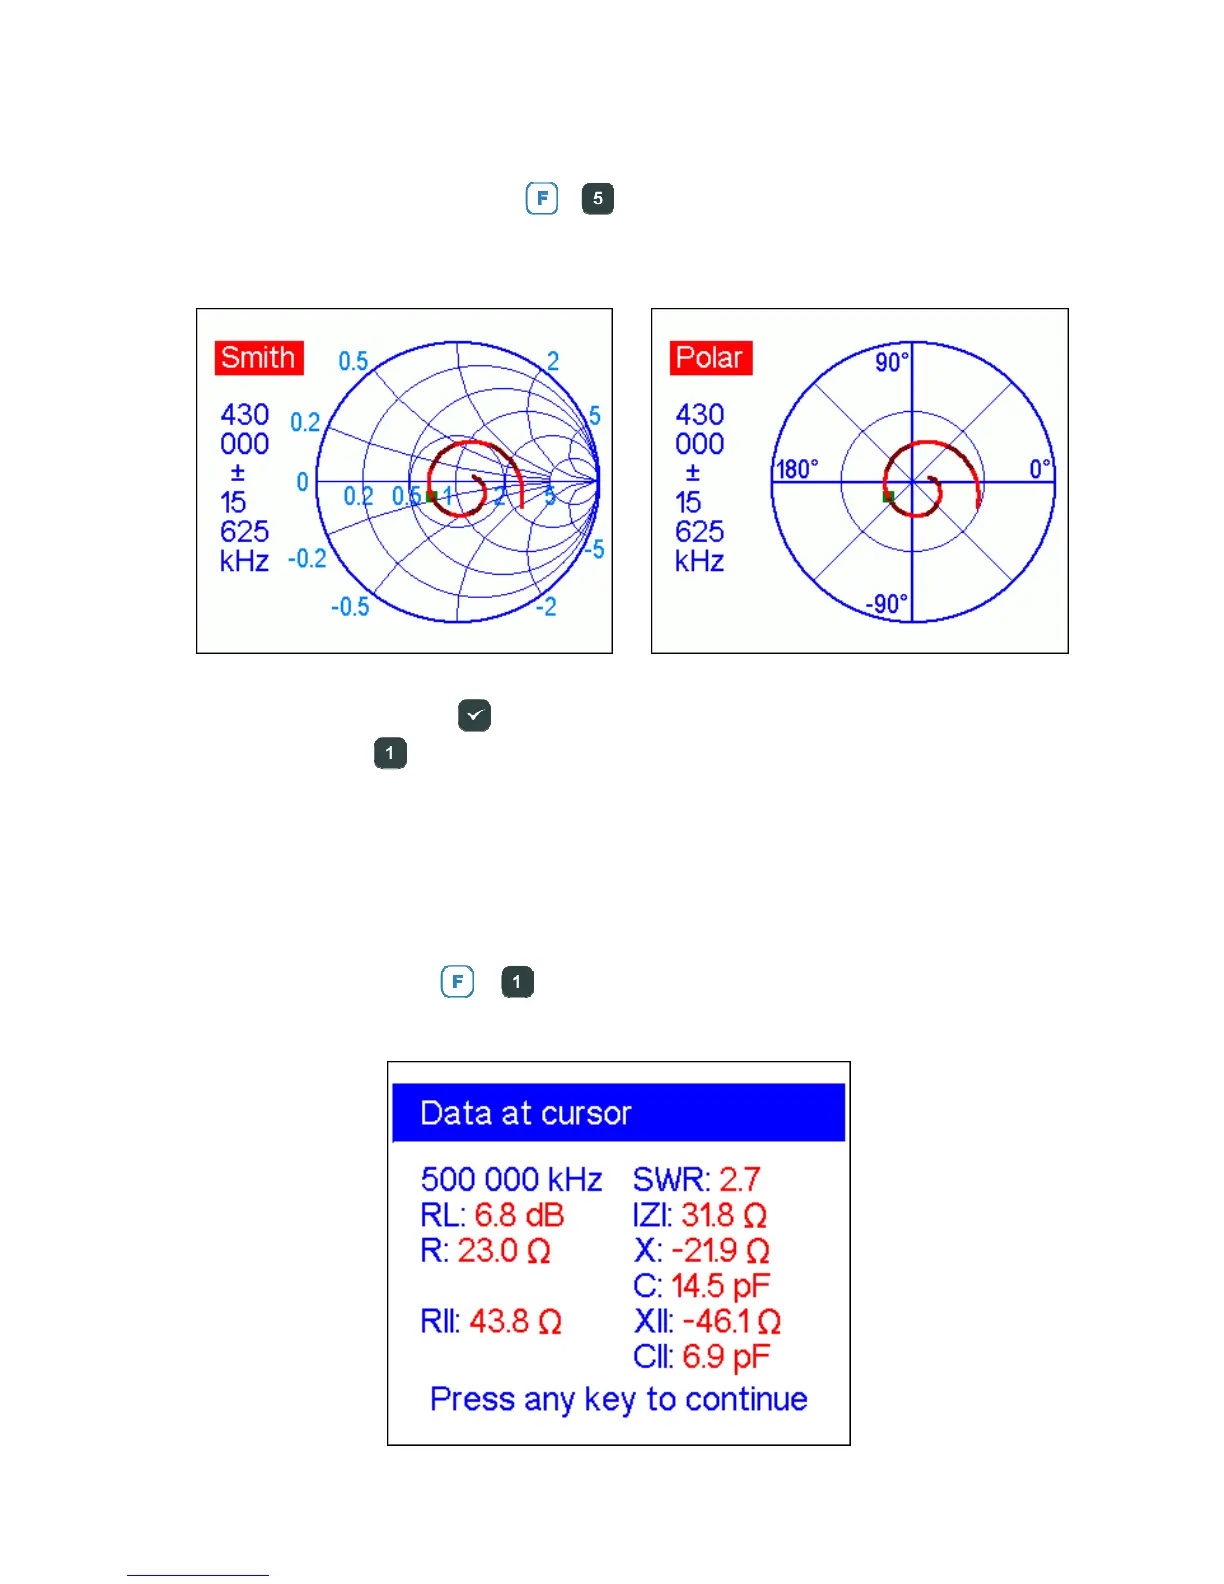
4.5.4. Data screen
In all graph modes, press
+ key combination to display various parameters at
cursor: