21
Unlike many other commercially-available reflectometers, RigExpert AA-600, AA-
1000 and AA-1400 do not send pulses into the cable. Instead, another technique is
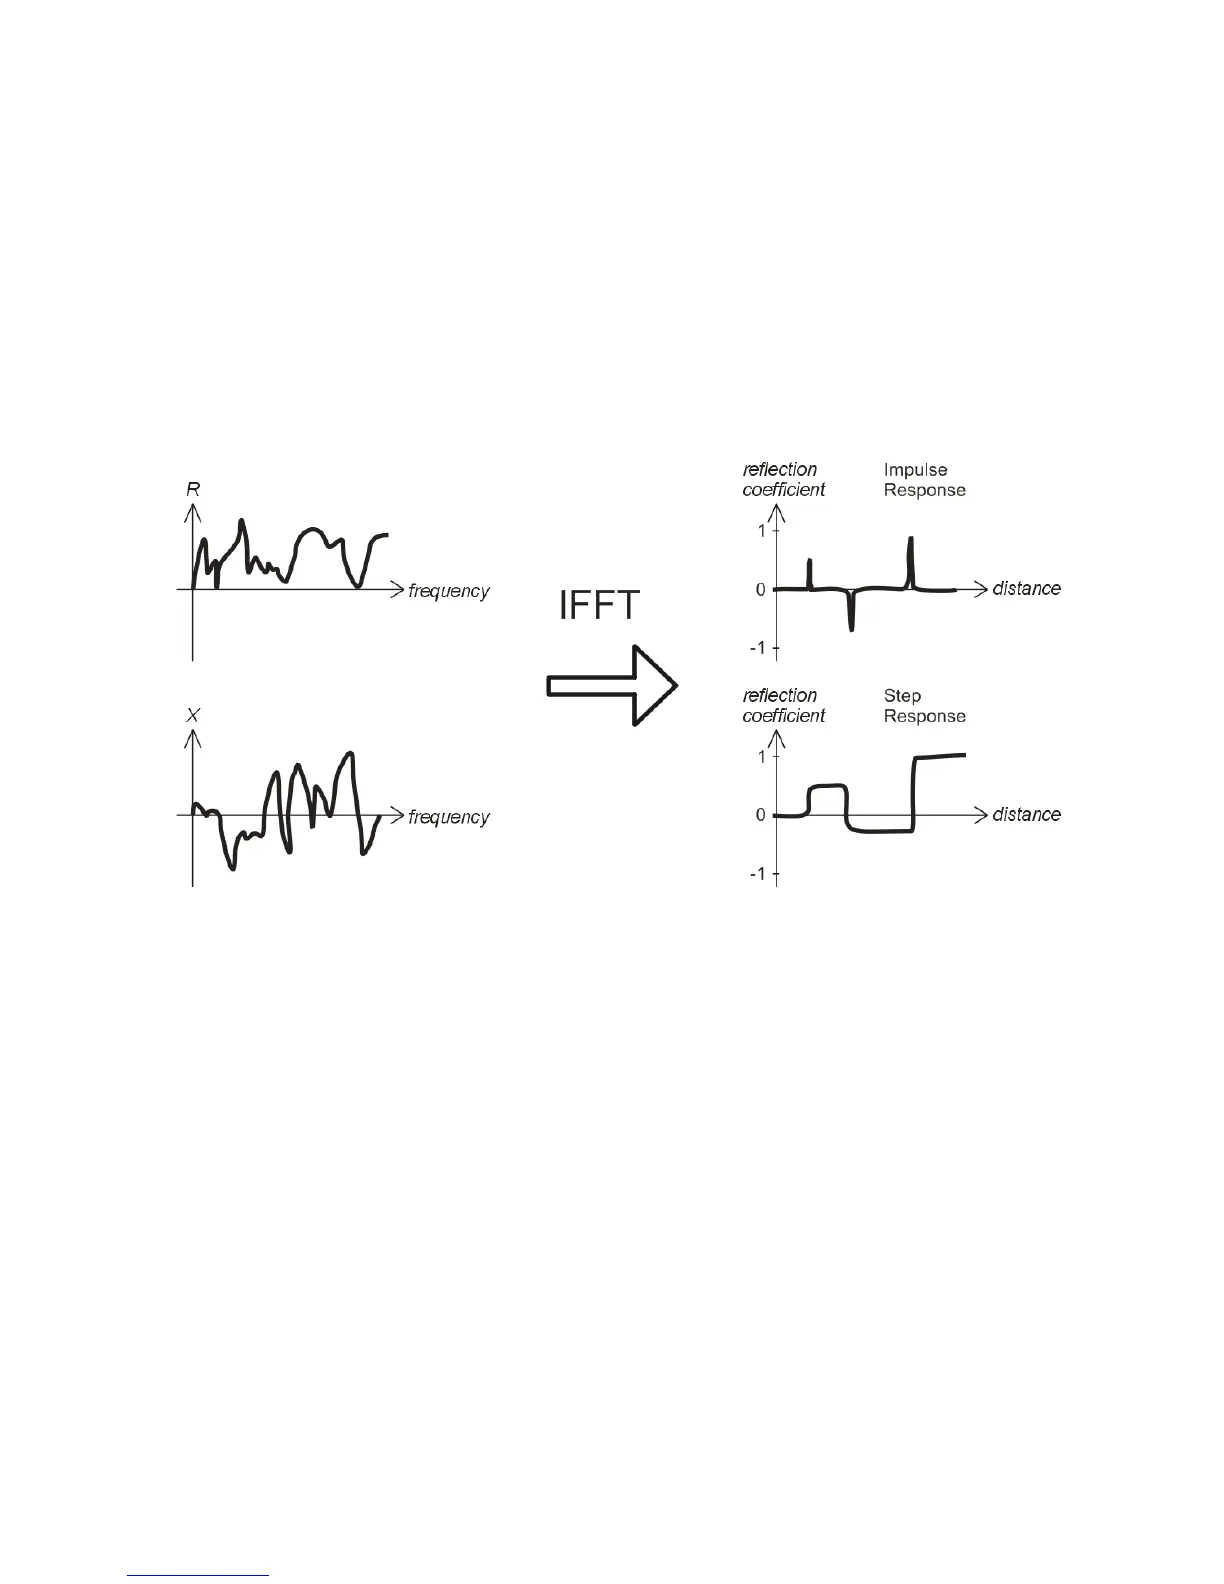
used. First, R and X (the real and the imaginary part of the impedance) are measured
over the whole frequency range (up to 600, 1000 or 1400 MHz). Then, the IFFT
(Inverse Fast Fourier Transform) is applied to the data. As a result, impulse response
and step response are calculated.
(This method is often called a “Frequency Domain Reflectometry”, but the “TDR”
term is used in this document since all calculations are made internally and the user can
only see the final result.)
The vertical axis of the resulting graphs displays the reflection coefficient: Γ=-1 for
short load, 0 for matched impedance load (Z
Load
=Z
0
), or +1 for open load. By
k
nowing the cable velocity factor, the horizontal axis is shown in the units of length.
Single or multiple discontinuities can be displayed on these graphs. While the
Impulse Response graph is suitable for measuring distance, the Step Response graph
helps in finding the cause of a fault.
See the examples of typical Step Response graphs on the next page.