25
and – select cable velocity factor for the TDR display
– select system impedance for SWR, Smith/polar chart and TDR displays
– select series or parallel representation (see page 12) for the R,X graph
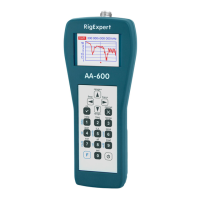
– go to the third page which contains analyzer self-test options
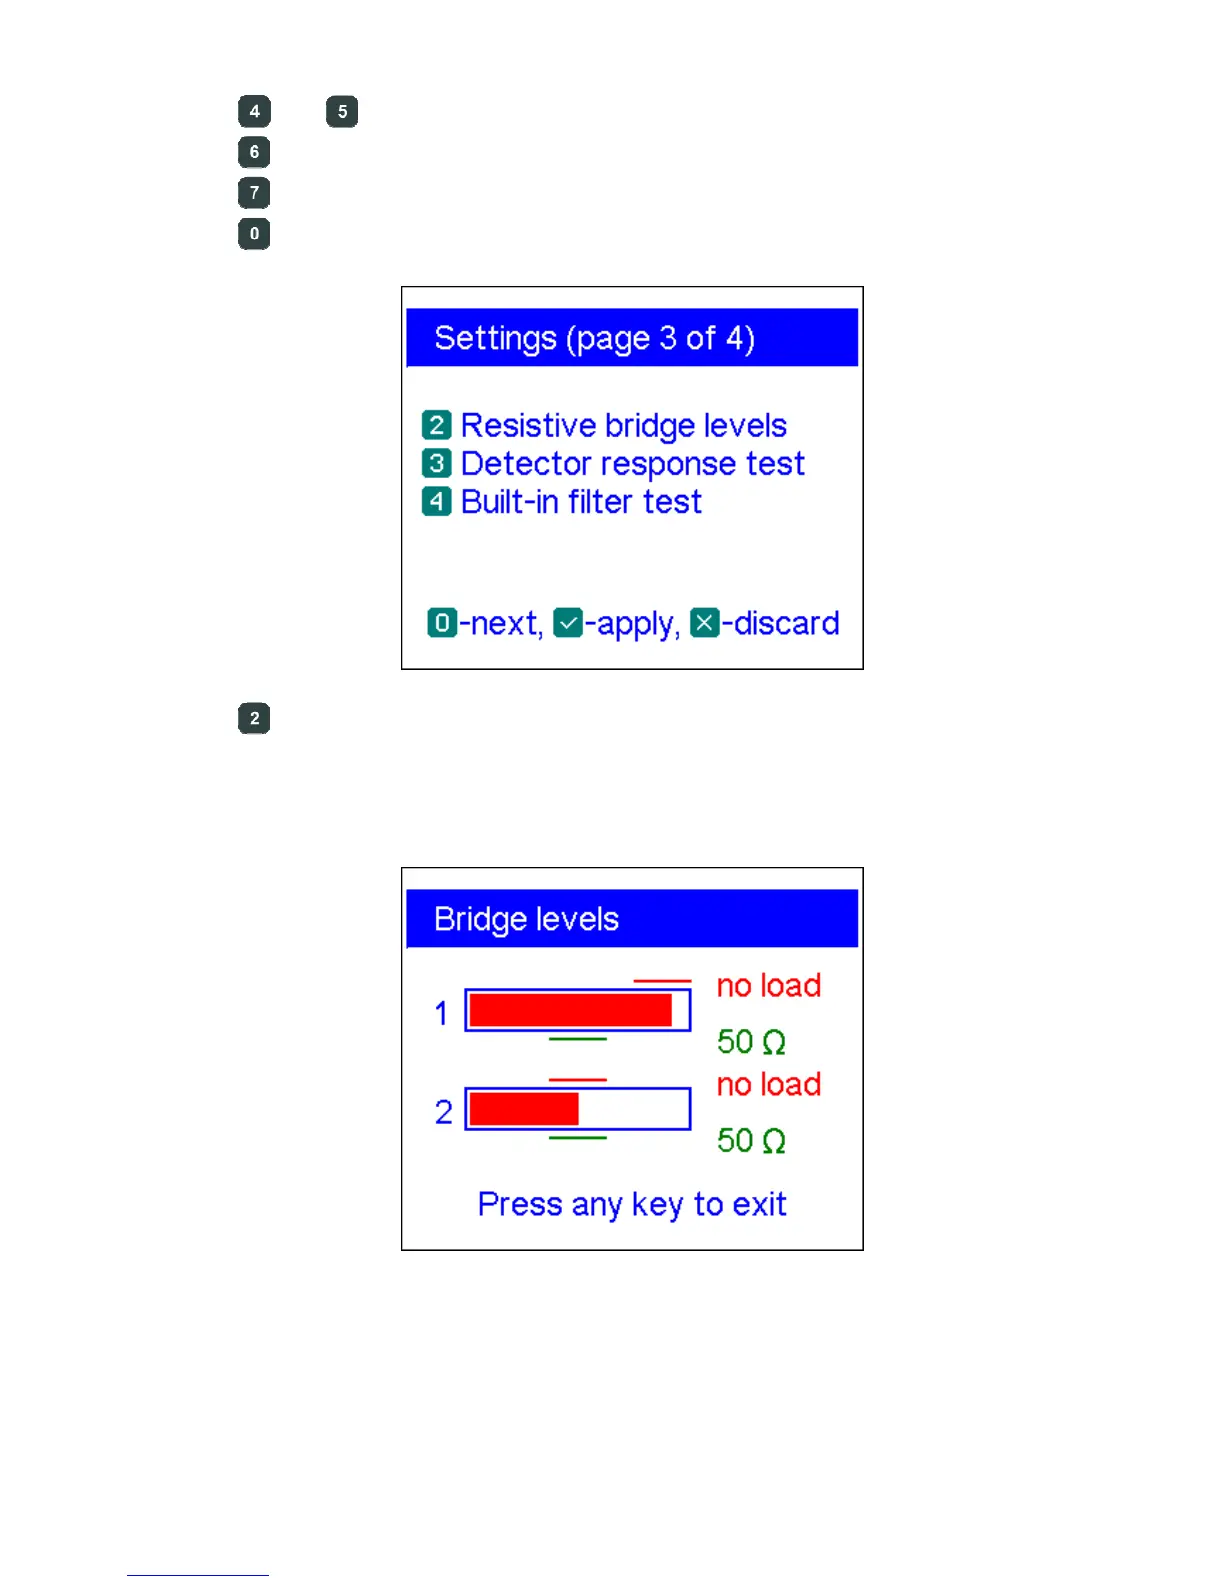
– RF bridge test. Two filled bars display signal levels at the left and at the
right legs of the resistive bridge. With no load at the antenna connector, the
screen should look like shown on the picture:
For the 50-Ohm load, the filled bars should stand at corresponding positions (notice
the “no load” and “50 Ω” marks):