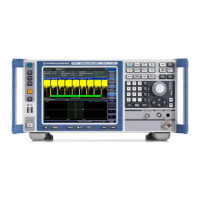
Measurements on CW Signals R&S FSH3
¾ Press the FREQ key.
¾ Enter “100” using the numeric keypad and confirm
the entry with the MHz key.
¾ Press the SPAN key.
¾ Enter “10” using the numeric keypad and confirm the
entry with the MHz key.
The R&S FSH3 now displays the generator signal with
a higher resolution.
The R&S FSH3 has markers for reading off signal levels and frequencies. Markers are always
positioned on the trace. Both the level and frequency at their current positions are displayed on the
screen.
¾ Press the marker key.
The marker is activated and is automatically positioned
on the trace maximum. A vertical line on the
measurement diagram indicates the marker frequency.
A short horizontal line on the trace indicates the level.
The R&S FSH3 displays the marker frequency and
level numerically at the top of the measurement
diagram.
Setting the Reference Level
The level shown by Spectrum Analyzers at the top of the measurement diagram is called the reference
level (REF LEVEL). To get the best dynamic range out of a Spectrum Analyzer, its full level range
should be used. This means that the maximum spectrum level should be at or close to the top of the
measurement diagram (= reference level).
The reference level is the maximum level on the level axis (y-axis).
Reduce the reference level by 10 dB to increase the dynamic range.
¾ Press the AMPT key.
The softkeys for the AMPT menu are displayed and the REF LEVEL softkey label is highlighted in red,
i. e. it is enabled for value entry. The red value entry box at the bottom right of the measurement
diagram displays the current reference level.
¾ Enter “30” using the numeric keypad and confirm the entry with the dBm key.
The reference level is now set to –30 dBm. The maximum trace value is close to the maximum scale
value of the measurement diagram. The increase in the displayed noise floor is minimal. The difference
between the signal maximum and the displayed noise (i.e. the dynamic range ) has, however, been
increased.
1145.5973.12 2.2 E-6

 Loading...


