Operation
There are two fundamentally different
types of display:
– display for analysis and test functions
– display for menu operation (such as
Setup or Program)
Analysis and Test Functions
This display is divided into 9 sections.
Unit
Graphic symbol
Print symbol
Info/Drying program status/Test function
Bar graph
Measured value/result
Function line
Plus/minus sign
Busy symbol
Example: Moisture Analysis
Info/Drying Program Status Line:
This line shows the following
information:
– Number of the drying program selected
(e.g.
P1)
– Drying temperature set,
e.g.
105
o
C
– Criterion for end-point recognition
(e.g.
Autom.)
– Current temperature
– Elapsed drying time
Busy symbol:
The
J symbol is shown here whenever
the moisture analyzer is processing
a function activated by pressing a key.
Plus/minus sign:
A plus or minus sign (
F
or
H
) is shown
here for the weight value or a calculated
value (such as a percentage).
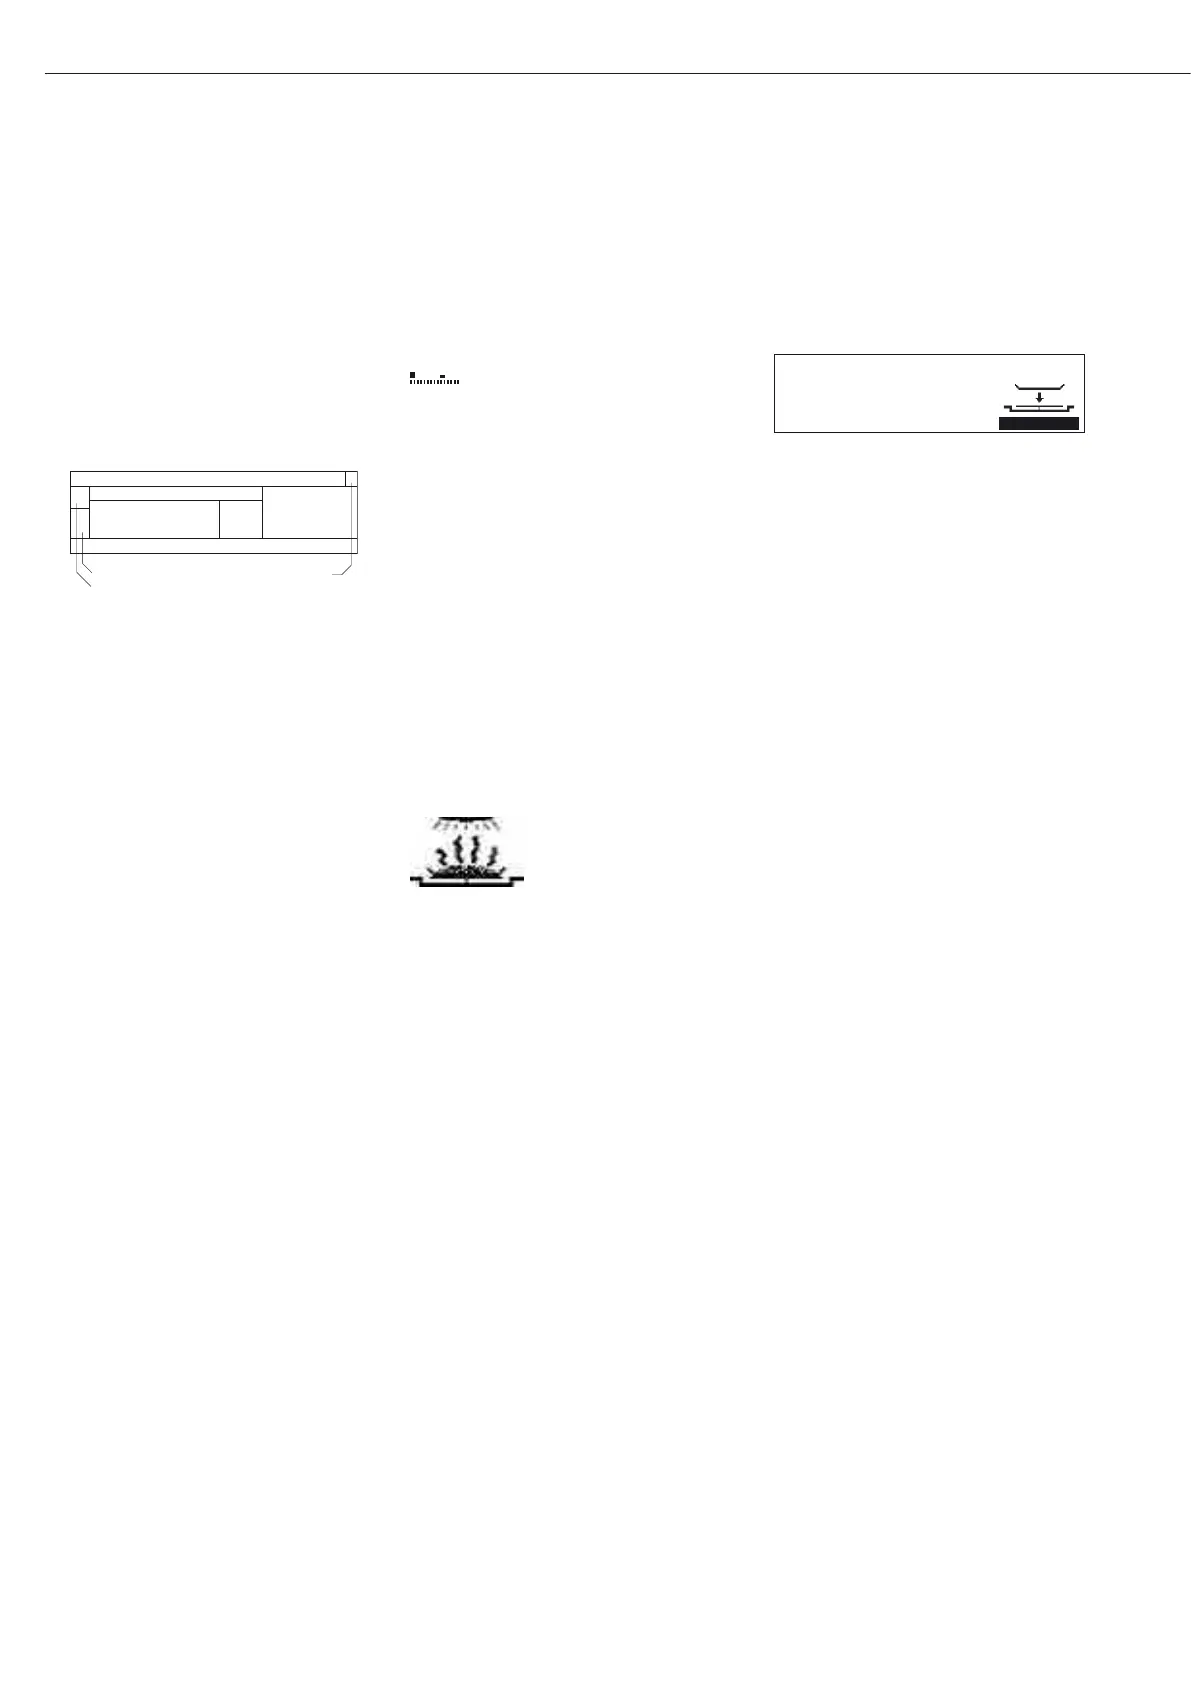
Bar graph:
The bar graph is shown during moisture
analysis if the “Initial Weight” option in the
drying program is set to
On.
The following symbols may appear:
Bar graph with separator tags
- Target value – 20%
= Target value
+ Target value +20%
Measured value/result:
This section shows the weight or
calculated value.
Unit:
Once the weighing system reaches
stability, the weight unit or calculation
unit is displayed here.
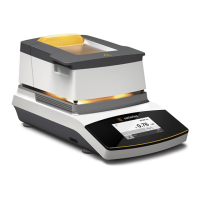
Graphic symbols:
The symbols shown here indicate the
current operating status of the moisture
analyzer. Example:
Drying in progress
Print symbol:
The following symbol is shown here
during the printout of analysis results
and other data:
P Printing
Function line:
This line indicates the functions that can
be activated by pressing u (inverse dis-
play), such as Setup menu, Program menu,
“Tare”, “Start”, or “Cal” (calibration).
PROGRAM
P1 105
o
C Auto.
S
0092
g
TARESETUP
This line is also used to output error text,
overwriting the complete line.
10