nova250 Touch Panel
Standard application
26 7001064003 T1 Sauter Systems
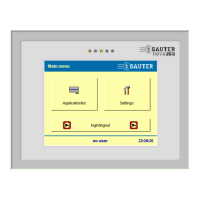
Fig. 4-20: Time Axis, X-scale
First, define the desired (time) range for
reading the HDB using the buttons
or the slider
.
Then select the end date with the timing
for the time range using the slider and
the buttons.
Press
to select the current date
with the current time as the end date.
Press to confirm your entry.
Press
to return to the HDB
configuration (Fig. 4-18), without making a
change.
These time ranges are possible:-
1 hour, 4 hours or 12 hours, 1 day, 7 days, 1 month, 3 or 6 months or 1 year.
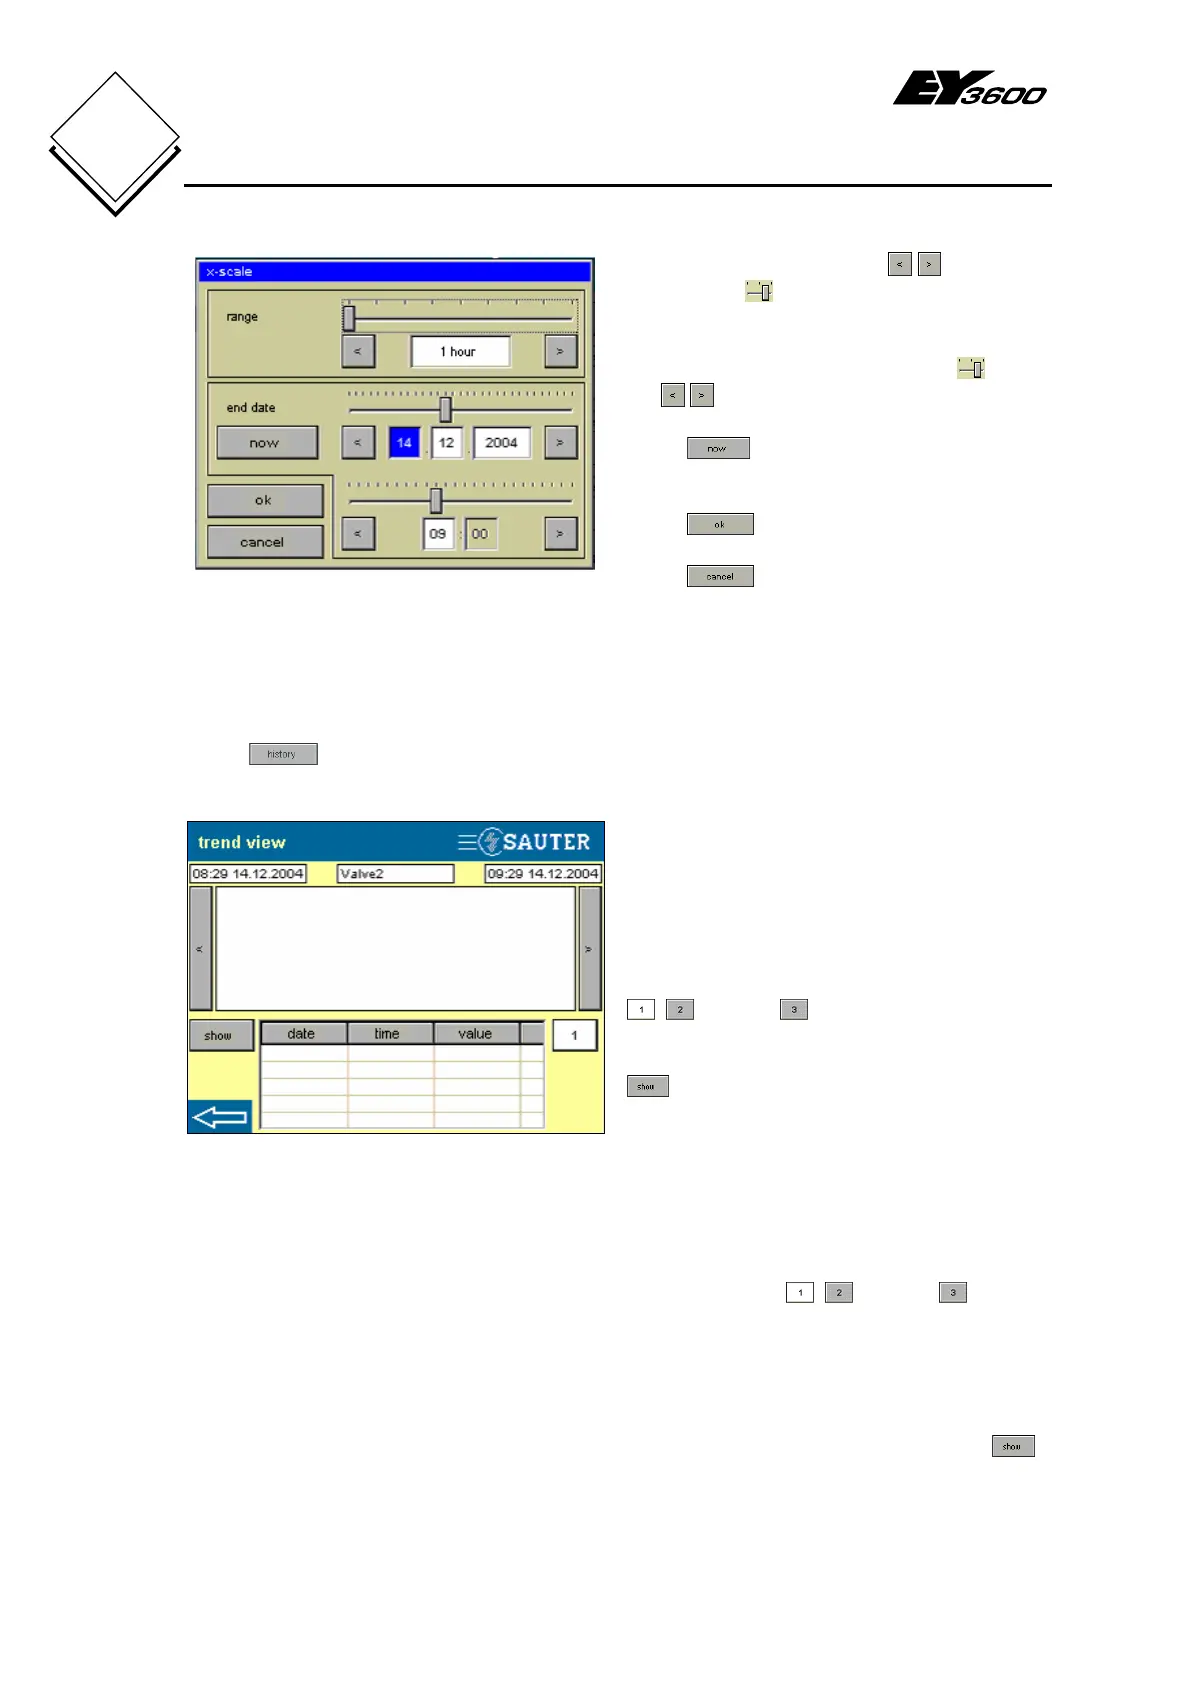
Press
to read the historical data for the selected data points from the AS. Fig.
4-21 shows an empty historical database.
Fig. 4-21: HDB View
Top: start date, house address, end date
Centre: graphic view with scroll function
Bottom: list of HDB entries for the active
data point with date, time and value
, or up to to activate the HDB
entries for the data point
visualises the selected entry with
lines in the graphic view
The date and time, according to the start and end of the time range, are shown above
the graphic view (left and right). The house address is at the top in the middle.
In the centre, you see the box for the graphic view of up to 3 data points. The HDB
entries are shown connected with a straight line. Use buttons
, or up to to
activate the data point (white is active, the line is bold; grey is inactive, the line is thin).
Use the scroll buttons to shift the graphic forwards or backwards around the time range
('scrolling').
At the bottom, you see the list of HDB entries for the active data point that have been
read, with time, date and value. If you select an HDB entry from the list and press
,
dotted lines will appear in the graphic for the selected point.